Hi all,
I have a jmeter script which send data to my influxDB every 30 min (Lets called runs), I need to filter that data in grafana and basically show ONLY the space where it is data. Basically, a zoom in in the graph.
The data is being displayed based in a time range, so there are huge spaces on the left and right side of the graph, and they are empty because there is not data there. If the user selects, as a range, the last 7 days or more, grafana collapse, so I added a variable asking for the specific run that the user wants but now I need to zoom in the data displayed.
Basically, you will have a range of 7 days or more and the data will use only 30 min of the graph, leaving A LOT OF EMPTY SPACE.
I need to achieve a graph a like this one with the zoom in already included in my query.
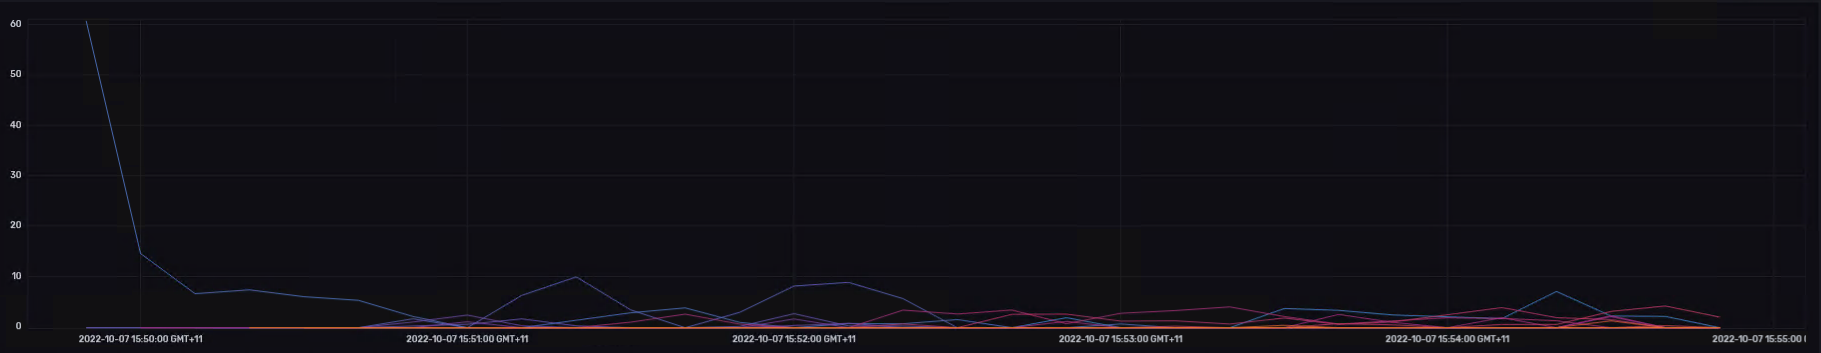
is it possible?
This is an example of the query.
from(bucket: “jmeter”)
|> range(start: v.timeRangeStart, stop: v.timeRangeStop)
|> filter(fn: (r) => r[“_measurement”] == “requestsRaw”)
|> filter(fn: (r) => r[“_field”] == “connectTime”)
|> aggregateWindow(every: v.windowPeriod, fn: mean, createEmpty: false)
|> yield(name: “mean”)
