Hi,
I’ve written the points test a=2,b=4 and test a=4,b=8 to InfluxDB 2.0, which I’m running using docker.
I’ve used the flux command:
from(bucket: "myBucket")
  |> range(start: -1hr)
  |> filter(fn: (r) => r["_measurement"] == "test")
  |> pivot(columnKey: ["_field"], rowKey: ["_time"], valueColumn:"_value" )
  |> yield()
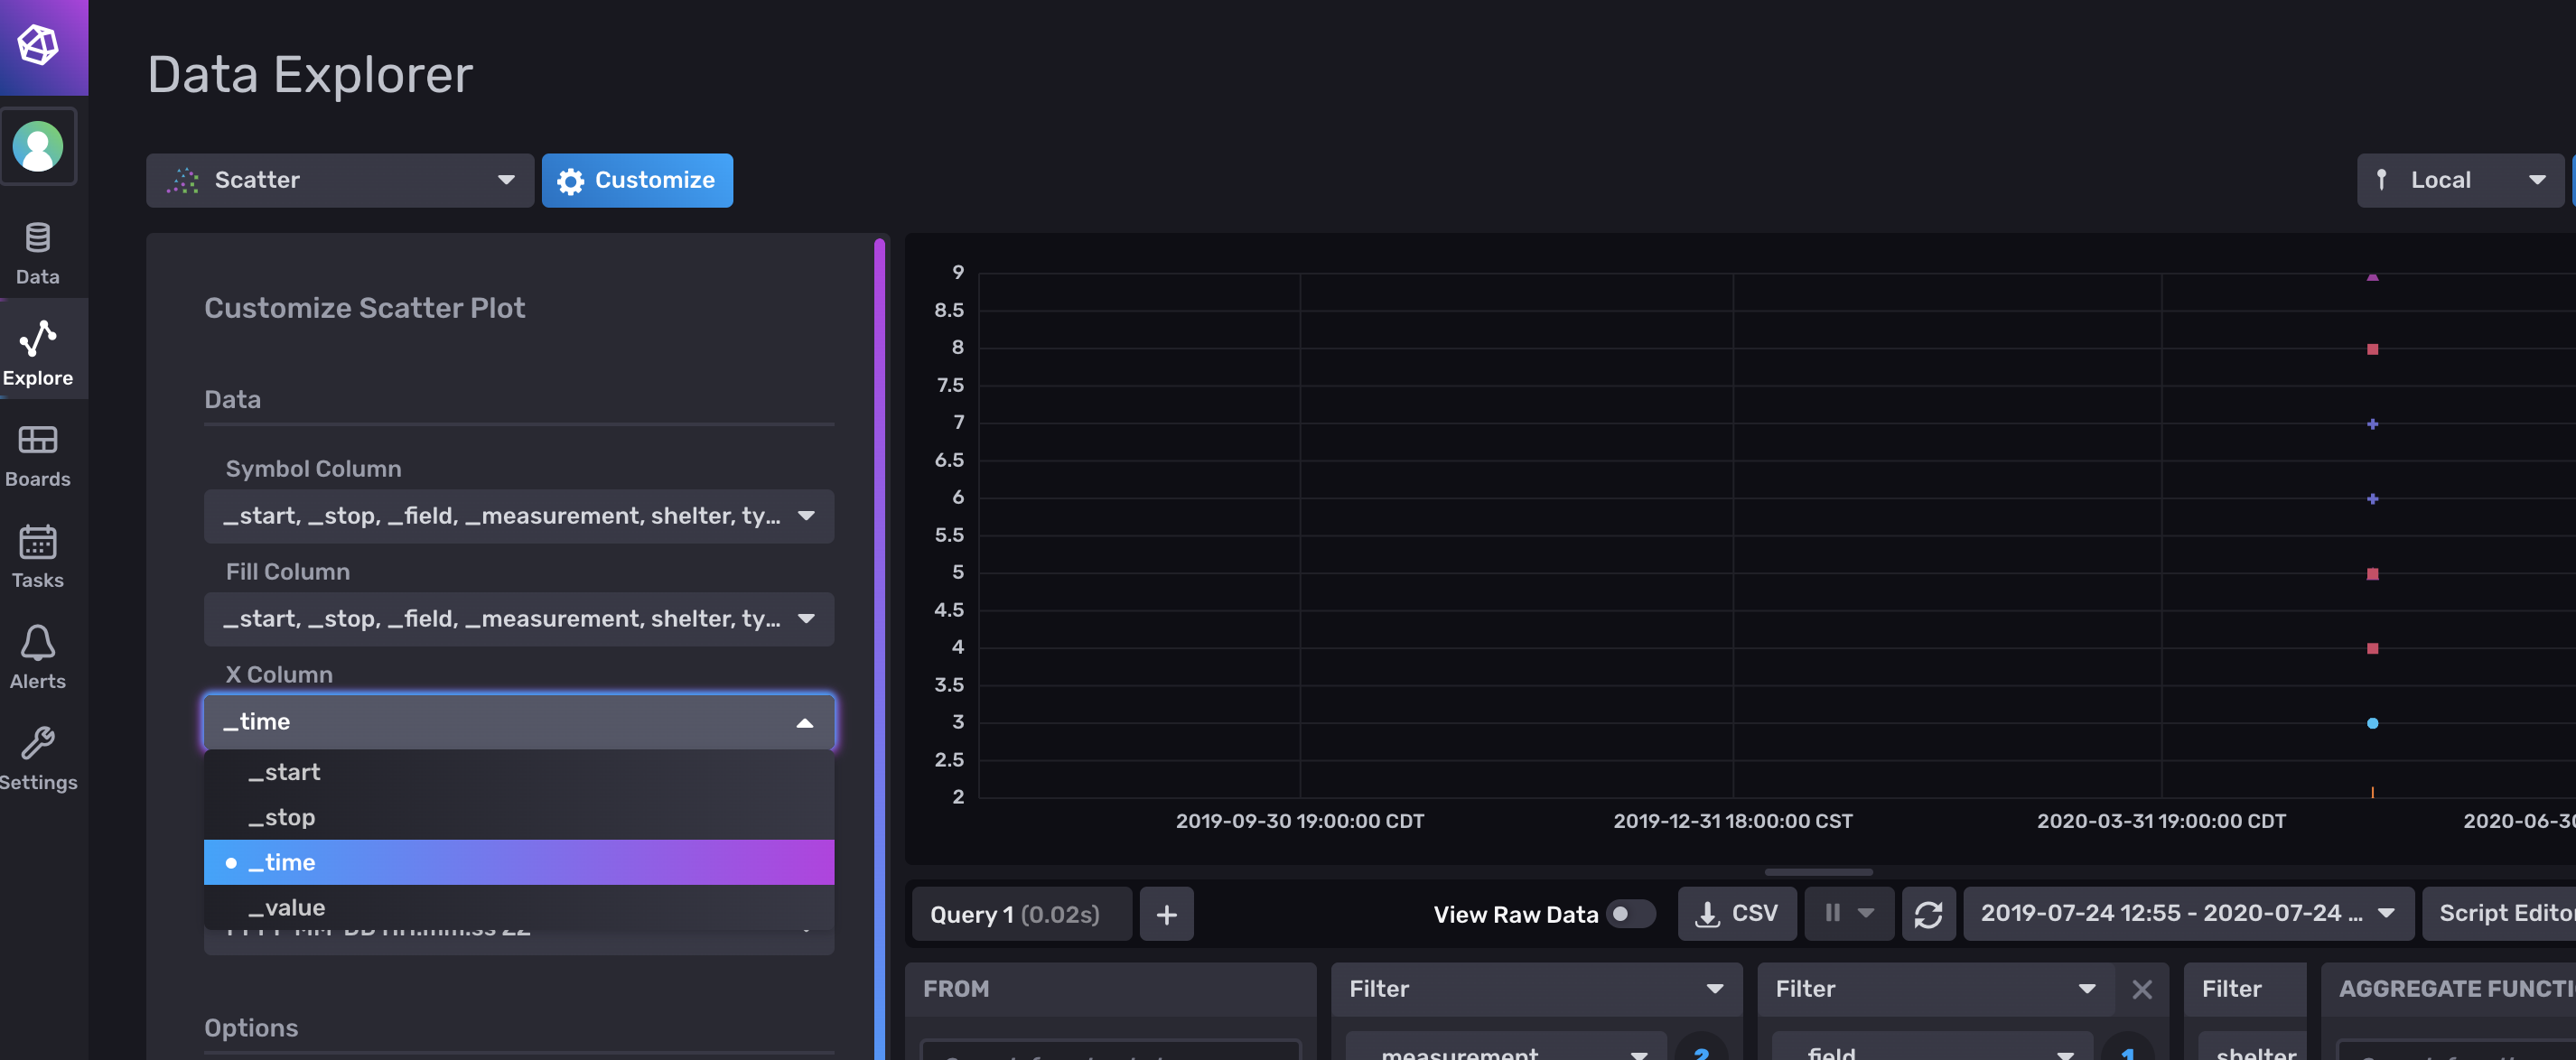
to get a table with columns for a and b. But when I try to create a scatter plot of “a” against “b”, I can’t seem to change the “X column” to anything other than “_time”? Is this deliberate, or am I doing something wrong?
Thanks for any help.
Jack
Yes it is! If you select customize you can change the x value with a drop down:
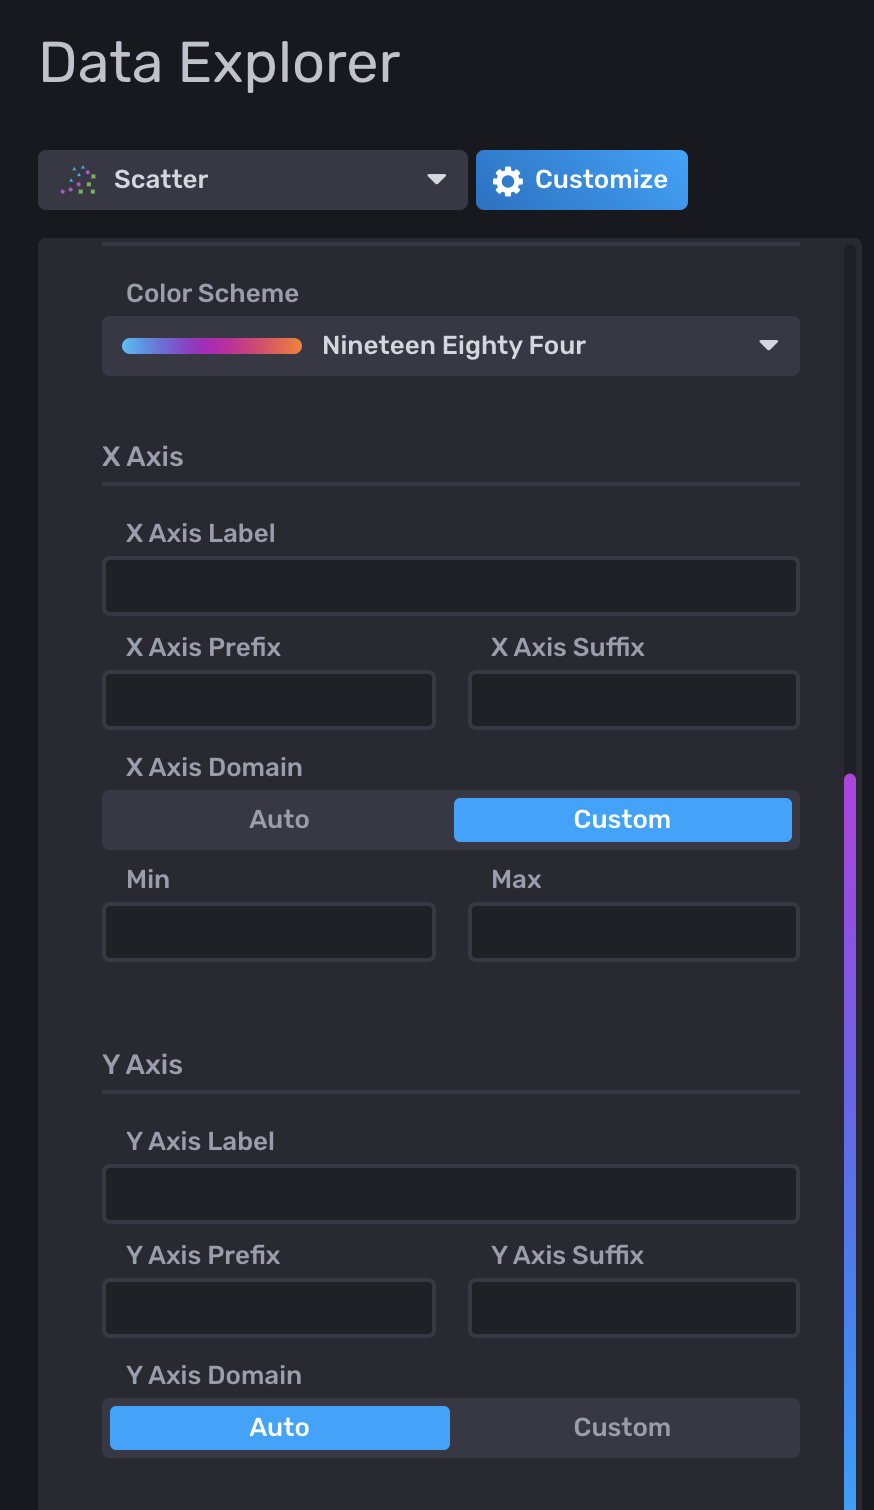
I was testing this and for some reason the X axis max/min goes to a huge range (1.5T on the far right) regardless of what i pick as the source aside from _time. The problem is that I can’t find any way to adjust the X domain for the scatter plot. There is that capability for the heatmap, so I’m using that for now.
Any suggestions? Thanks!
Hello @bobrich,
Welcome! Yes you can set the domain for the x axis for a scatter plot:
Hi there! Thanks for the quick reply! I don’t seem to have that option for some reason:
It says i’m on version 2.0.3 (fe04d34)