I am using grafana 10.4.1 as part of home assistant on a raspi 4 together with influxdb 1.8.10.
I want to have a cumulative sum in a graph of my savings from my solar panels. That is easy in my eyes as long a the kWh cost remains constant. I do have a metric with the sum of the self-used kWh and this can be multiplied by some constant kWh cost.
But now I do have 2 kWh cost changes in fast succession and I want that cumulative sum still to be correct. So I introduced a new metric with the kWh cost to move away from that constant kWh cost.
But when integrating this into an influxql query (I want to use this query from grafana later) I do get no results and no error while all the series do have data!
select
CUMULATIVE_SUM( SUM(saving) )
from
(
    select
	self_used_kwh * cost_kwh as saving
    from
    (
        SELECT max("value") - min("value") as self_used_kwh FROM ha_db.autogen."kWh" WHERE ("friendly_name"::tag = 'Solar_selbst_verbraucht_Summe')
    ),
    (
        SELECT mean("value") as cost_kwh FROM ha_db.autogen."EUR" WHERE ("friendly_name"::tag = 'Strom_Preis_pro_kWh')
    )
)
GROUP BY time(1d)
fill(previous)
@robertortel I think what you’re trying to do would actually require a join to align associated values into rows. Unfortunately, InfluxQL doesn’t support joins. I know this query is possible in Flux. Are you open to using Flux for this?
I am open to use flux, but it will only help me in case grafana can issue such query as well. I want to bring the result into a grafana dashboard with other graphs.
Do you know whether and how I can issue a flux query from grafana?
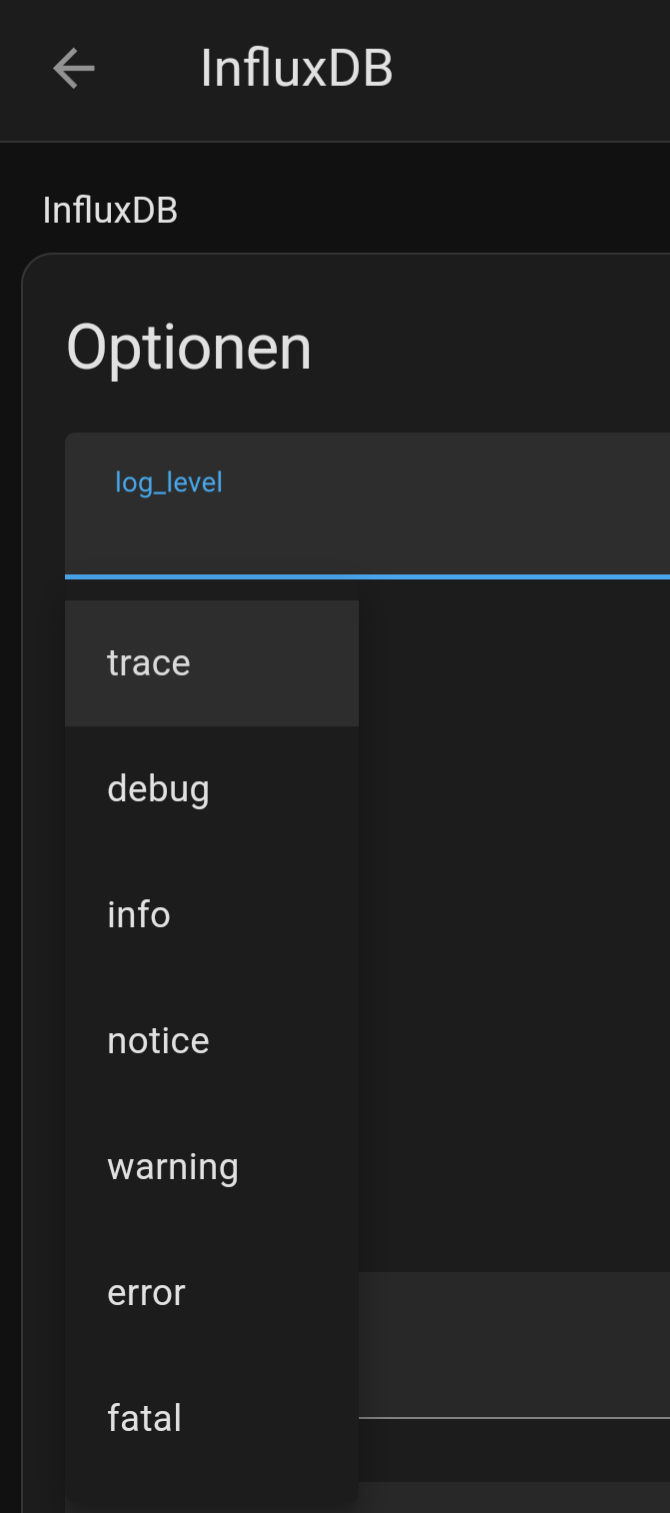
The “trace” log level will give you the most detail, but I don’t know how much it will help with the 500. Another thing to check is to make sure Flux is enabled in your InfluxDB 1.8 instance.
Interesting. I’m thinking this is probably related to an issue with the specific version of Flux packaged with InfluxDB 1.8.10. Unfortunately, it’s an old version of Flux and can’t be upgraded due to some dependency changes in Flux itself. The only way to get a newer version of Flux would be to upgrade to the latest version of InfluxDB v2, but I know this isn’t an option for many.
As posted in the first bug, this might be related to only “fn:max yields”. I can’t see such parameters in your flux query, which indicates that it might be not that easy. But sometimes query rewrites make a difference … . Any suggestions maybe?
And there is even some documentation on how to migrate from my influx 1.x to this influx 2.x. Well … more work to do, but at least this is something :-).
Yesterday I did check that already on my phone and read somewhere (but can’t find it now) that influx 2.x no longer supports influxql and I have to rebuild all my grafana queries to flux. Is that really true?
No, that’s not true. It was when v2 was first released, but InfluxQL support was added later on. It does require a little bit of setup since InfluxQL queries require a database and retention policy which were combined and replaced with “buckets” in v2. You have to map database/retention-policy combinations to v2 buckets to be able to use InfluxQL. Here’s some more information: https://docs.influxdata.com/influxdb/v2/query-data/influxql/
Ok, so I do have an influx v2 meanwhile and migrated my influx v1 data to it. Home assistant is still writing into influx v1. That switch will happen later.
I had to add those 2 “filter(fn: (r) => r[”_field"] == “value”)" lines and adjusted the range to test with it from influx2 data explorer.
But now it does only return a flat line with all values being zero. I can only suspect this is because the cost_kwh table has only very few values. It does only get a new value when my kWh cost changes, which I made manually for june 2023 where I started with home assistant and now 2 times within april 2024. So only 3 values in 10 months. Any ideas on that?
I noticed as well, that Flux did become deprecated with Influxdb v3 and sql and influxql are more focussed. Does this have any effect on influxdv 2 and the influxql capabilities here? Maybe such cumulative sum is now possible with influxql?
I’d have to see the actual query results to really give any proper guidance. I’m guessing that the visualization is just connect the disparate points and there’s actually large gaps in time with no data. Is that the case?
This has no effect on InfluxDB v2.
Cumulative sum is supported in InfluxQL with all version of InfluxDB:
Well … I got confused here, as you told me to go to influx 2 to make that possible. But this was due to the join nature of my query, right, and not only from my request for a cum. sum?
I would like to show you some data here, but the result shows up as 3 tables when selecting raw data and I am only allowed to put one image in a post here . Is there a way export such result from the data explorer to a csv to upload it here in one file?
Ok, whatever I told earlier with those 3 tables … it seems I was wrong. But it is indeed 2 tables which I do get as a result.
I selected 7 days (02.04. 00:00 until 09.04. 00:00) of old data here which are part of the period for which I did migrate that old data from my influx 1. You can see the result below.
Stuff to note:
that weird first line which looks like a different table
The single cost_kwh data only for the 07.04. while no cost change happened on that day. However a home assistant (HA) restart on that day may have caused that. But as the current mechanism only writes new data into that series on a real cost change (or on HA restart) there. So it is expected to be empty for very most days and should get its last real value, no matter at how many days in the past that last data exists