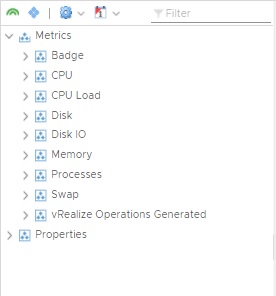
I have installed telegraf 1.17 on my redhat7 actually it send data to other app (vmware vrealize operation ) and I can see metrics such as CPU , disk , memory in vrops such as attach pic but I cannot see anything about network status (send , receive , …) how can add these metrics to my telegraf ?
Also I have attached telegraf.conf telegraf.txt (272.4 KB)
2 - According to attach pic we have some metrics for cpu such as usage guest , usage guest nice, usage nice, usage … How can understand what is each one ? for example which one show how much my cpu usage now ?
Thanks, but would you please advice me how can use it ?
Do I have to just add follow code to telegraf.conf ?
# Collect response time of a TCP or UDP connection
[[inputs.net_response]]
  ## Protocol, must be "tcp" or "udp"
  ## NOTE: because the "udp" protocol does not respond to requests, it requires
  ## a send/expect string pair (see below).
  protocol = "tcp"
  ## Server address (default localhost)
  address = "localhost:80"

  ## Set timeout
  # timeout = "1s"

  ## Set read timeout (only used if expecting a response)
  # read_timeout = "1s"

  ## The following options are required for UDP checks. For TCP, they are
  ## optional. The plugin will send the given string to the server and then
  ## expect to receive the given 'expect' string back.
  ## string sent to the server
  # send = "ssh"
  ## expected string in answer
  # expect = "ssh"

  ## Uncomment to remove deprecated fields; recommended for new deploys
  # fielddrop = ["result_type", "string_found"]
Hi @baber,
You are correct. If you would like to add the input plugin. Add this to your current config file:
# Collect response time of a TCP or UDP connection
# TCP example
[[inputs.net_response]]
  protocol = "tcp"
  ## Server address (default localhost)
  address = "localhost:80"

# UDP Example:
# Collect response time of a TCP or UDP connection
[[inputs.net_response]]
  protocol = "UDP"
  ## Server address (default localhost)
  address = "localhost:80"

  ## The following options are required for UDP checks. For TCP, they are
  ## optional. The plugin will send the given string to the server and then
  ## expect to receive the given 'expect' string back.
  ## string sent to the server
   send = "ssh"
  ## expected string in answer
   expect = "ssh"
 [[inputs.net_response]]
#   ## Protocol, must be "tcp" or "udp"
#   ## NOTE: because the "udp" protocol does not respond to requests, it requires
#   ## a send/expect string pair (see below).
   protocol = "tcp"
#   ## Server address (default localhost)
   address = "localhost:80"
#
#   ## Set timeout
    timeout = "1s"
#
#   ## Set read timeout (only used if expecting a response)
    read_timeout = "1s"
#
#   ## The following options are required for UDP checks. For TCP, they are
#   ## optional. The plugin will send the given string to the server and then
#   ## expect to receive the given 'expect' string back.
#   ## string sent to the server
    send = "ssh"
#   ## expected string in answer
    expect = "ssh"
#
#   ## Uncomment to remove deprecated fields
    fielddrop = ["result_type", "string_found"]
and start telegraf without any error . Now my problems is cannot see network metric in my monitoring app
Hi @baber,
I have run and tested two config examples for net, net_stats (config 1) and net_response (config 2). Could you try and run config 1 for me? These plugins I believe will provide stats closer to what you are looking for.
With regards to not seeing metrics can you please check the rest of your config for *pass or *drop as these will prevent metrics from reaching your DB instance since they provide filtering functionality.
Thanks. But confuse. in above links I can just see 2 files:
telegraf-net.conf and telegraf-netResponse.conf . and as I previously said I want add network metrics to previous metrics so Is that your means add contents to telegraf.conf ? which file’s content ? telegraf-net.conf or telegraf-netResponse.conf ?
@baber,
I am a little confused. In the config file, you sent me you don’t have any output plugins? Can you let me know where you plan to output your data? I have added the input plugins to the config nevertheless: telegraf_baber_altered.txt (272.7 KB)
Actually I don’t know I just did according to a doc
because I am a virtual engineer and want use this method . also I replaced the new telegraf.conf file with previously but another not happened and my metrics did not changed