Would you please help me for that issue ?
Hi @baber,
Can you run the following command for me please:
telegraf --test --config <path_to_config>
I would like to see what metrics are being read from the system. If we find the net metrics then we know its a problem with the output plugin
This is my output :
[root@ptest1 ~]# telegraf --test --config /usr/telegraf/etc/telegraf/telegraf.conf
bash: telegraf: command not found…
Hi @baber,
Are you running this on the same system that Telegraf is installed on? Telegraf should be accessible to you as you have been running the service.
Dear @Jay_Clifford Yes . This is exactly that server that telegraf is running on that this is output :
[root@ptest1 ~]# ps -ef | grep telegraf
root 150827 150756 0 14:29 pts/1 00:00:00 grep --color=auto telegraf
root 158348 1 0 Nov30 ? 00:29:10 /usr/telegraf/usr/bin/telegraf -config /usr/telegraf/etc/telegraf/telegraf.conf -config-directory /usr/telegraf/etc/telegraf/telegraf.d
Unfortunately telegraf cannot start as service on my os and I have to run this with follow command :
/usr/telegraf/usr/bin/telegraf -config /usr/telegraf/etc/telegraf/telegraf.conf -config-directory /usr/telegraf/etc/telegraf/telegraf.d &
Okay. Please then run the following command:
/usr/telegraf/usr/bin/telegraf --test -config /usr/telegraf/etc/telegraf/telegraf.conf -config-directory /usr/telegraf/etc/telegraf/telegraf.d &
I have attached output
output.txt (59.9 KB)
So good news is that the net results are being collected:
> net,host=ptest1,interface=ens12f0 bytes_recv=80702944i,bytes_sent=577630405i,drop_in=0i,drop_out=0i,err_in=0i,err_out=0i,packets_recv=639055i,packets_sent=602282i 1638875106000000000
> net,host=ptest1,interface=ens12f1 bytes_recv=42869194i,bytes_sent=0i,drop_in=3346i,drop_out=0i,err_in=0i,err_out=0i,packets_recv=491077i,packets_sent=0i 1638875106000000000
> net,host=ptest1,interface=eno1 bytes_recv=0i,bytes_sent=0i,drop_in=0i,drop_out=0i,err_in=0i,err_out=0i,packets_recv=0i,packets_sent=0i 1638875106000000000
> net,host=ptest1,interface=eno2 bytes_recv=0i,bytes_sent=0i,drop_in=0i,drop_out=0i,err_in=0i,err_out=0i,packets_recv=0i,packets_sent=0i 1638875106000000000
> net,host=ptest1,interface=eno3 bytes_recv=0i,bytes_sent=0i,drop_in=0i,drop_out=0i,err_in=0i,err_out=0i,packets_recv=0i,packets_sent=0i 1638875106000000000
> net,host=ptest1,interface=eno4 bytes_recv=0i,bytes_sent=0i,drop_in=0i,drop_out=0i,err_in=0i,err_out=0i,packets_recv=0i,packets_sent=0i 1638875106000000000
> net,host=ptest1,interface=team0 bytes_recv=127223791i,bytes_sent=1115874924i,drop_in=3346i,drop_out=0i,err_in=0i,err_out=0i,packets_recv=912122i,packets_sent=468543i 1638875106000000000
> net,host=ptest1,interface=ens5f0 bytes_recv=89501129i,bytes_sent=597039203i,drop_in=0i,drop_out=0i,err_in=0i,err_out=0i,packets_recv=495954i,packets_sent=610184i 1638875106000000000
> net,host=ptest1,interface=ens5f1 bytes_recv=42869194i,bytes_sent=0i,drop_in=3346i,drop_out=0i,err_in=0i,err_out=0i,packets_recv=491077i,packets_sent=0i 1638875106000000000
> net,host=ptest1,interface=all
So next step is to find out why your results are not being showed via your interface. As i do not use VMware is the screen shot you sent me previously related to this step in the instructions:
What to do next
You can view metrics by selecting the relevant object > Metrics Tab from the vRealize Operations Cloud user interface.
@Jay_Clifford unfortunately just show these metrics :
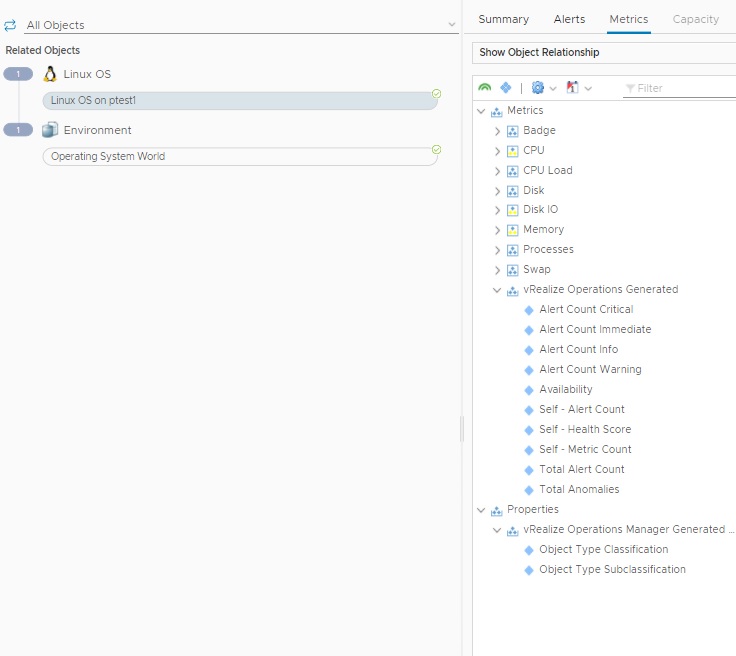
@baber, Sadly I would say this needs to be pushed back to the VMware support team. Telegraf is collecting all metrics as intended so the issue appears to be the mapping on the VMware side. This is sadly something we cannot help with.
You could always post this issue within our Slack Telegraf channel and see if any other VMware users can help. The last things to try are as follows:
- Merge all configs into one Telegraf config (including your output plugin) to make sure there is no disconnect there.
@Jay_Clifford
I cannot understand this part " Merge all configs into one Telegraf config (including your output plugin)"
How do that ?
The other question is how can run telegraf as service . I could not do it .
Dear @Jay_Clifford . Would you please help me about it ?
So to merge I am suggesting you move all plugins into one config like so. This should be copied into /usr/telegraf/etc/telegraf/telegraf.conf:
# Telegraf Configuration
#
# Telegraf is entirely plugin driven. All metrics are gathered from the
# declared inputs, and sent to the declared outputs.
#
# Plugins must be declared in here to be active.
# To deactivate a plugin, comment out the name and any variables.
#
# Use 'telegraf -config telegraf.conf -test' to see what metrics a config
# file would generate.
#
# Environment variables can be used anywhere in this config file, simply surround
# them with ${}. For strings the variable must be within quotes (ie, "${STR_VAR}"),
# for numbers and booleans they should be plain (ie, ${INT_VAR}, ${BOOL_VAR})


# Global tags can be specified here in key="value" format.
[global_tags]
  # dc = "us-east-1" # will tag all metrics with dc=us-east-1
  # rack = "1a"
  ## Environment variables can be used as tags, and throughout the config file
  # user = "$USER"


# Configuration for telegraf agent
[agent]
  ## Default data collection interval for all inputs
  interval = "30s"
  ## Rounds collection interval to 'interval'
  ## ie, if interval="10s" then always collect on :00, :10, :20, etc.
  round_interval = true

  ## Telegraf will send metrics to outputs in batches of at most
  ## metric_batch_size metrics.
  ## This controls the size of writes that Telegraf sends to output plugins.
  metric_batch_size = 1000

  ## Maximum number of unwritten metrics per output.  Increasing this value
  ## allows for longer periods of output downtime without dropping metrics at the
  ## cost of higher maximum memory usage.
  metric_buffer_limit = 10000

  ## Collection jitter is used to jitter the collection by a random amount.
  ## Each plugin will sleep for a random time within jitter before collecting.
  ## This can be used to avoid many plugins querying things like sysfs at the
  ## same time, which can have a measurable effect on the system.
  collection_jitter = "0s"

  ## Default flushing interval for all outputs. Maximum flush_interval will be
  ## flush_interval + flush_jitter
  flush_interval = "60s"
  ## Jitter the flush interval by a random amount. This is primarily to avoid
  ## large write spikes for users running a large number of telegraf instances.
  ## ie, a jitter of 5s and interval 10s means flushes will happen every 10-15s
  flush_jitter = "0s"

  ## By default or when set to "0s", precision will be set to the same
  ## timestamp order as the collection interval, with the maximum being 1s.
  ##   ie, when interval = "10s", precision will be "1s"
  ##       when interval = "250ms", precision will be "1ms"
  ## Precision will NOT be used for service inputs. It is up to each individual
  ## service input to set the timestamp at the appropriate precision.
  ## Valid time units are "ns", "us" (or "µs"), "ms", "s".
  precision = ""

  ## Log at debug level.
  # debug = false
  ## Log only error level messages.
  # quiet = false

  ## Log target controls the destination for logs and can be one of "file",
  ## "stderr" or, on Windows, "eventlog".  When set to "file", the output file
  ## is determined by the "logfile" setting.
  # logtarget = "file"

  ## Name of the file to be logged to when using the "file" logtarget.  If set to
  ## the empty string then logs are written to stderr.
  # logfile = ""

  ## The logfile will be rotated after the time interval specified.  When set
  ## to 0 no time based rotation is performed.  Logs are rotated only when
  ## written to, if there is no log activity rotation may be delayed.
  # logfile_rotation_interval = "0d"

  ## The logfile will be rotated when it becomes larger than the specified
  ## size.  When set to 0 no size based rotation is performed.
  # logfile_rotation_max_size = "0MB"

  ## Maximum number of rotated archives to keep, any older logs are deleted.
  ## If set to -1, no archives are removed.
  # logfile_rotation_max_archives = 5

  ## Override default hostname, if empty use os.Hostname()
  hostname = ""
  ## If set to true, do no set the "host" tag in the telegraf agent.
  omit_hostname = false


###############################################################################
#                            INPUT PLUGINS                                    #
###############################################################################

[[inputs.cpu]]
  ## Whether to report per-cpu stats or not
  percpu = true
  ## Whether to report total system cpu stats or not
  totalcpu = true
  ## If true, collect raw CPU time metrics.
  collect_cpu_time = false
  ## If true, compute and report the sum of all non-idle CPU states.
  report_active = false


# Read metrics about disk usage by mount point
[[inputs.disk]]

  ignore_fs = ["tmpfs", "devtmpfs", "devfs", "iso9660", "overlay", "aufs", "squashfs"]


# Read metrics about disk IO by device
[[inputs.diskio]]


# Get kernel statistics from /proc/stat
[[inputs.kernel]]
  # no configuration


# Read metrics about memory usage
[[inputs.mem]]
  # no configuration


# Get the number of processes and group them by status
[[inputs.processes]]
  # no configuration


# Read metrics about swap memory usage
[[inputs.swap]]
  # no configuration


# Read metrics about system load & uptime
[[inputs.system]]
  ## Uncomment to remove deprecated metrics.
   fielddrop = ["uptime_format"]


[[inputs.netstat]]

[[inputs.net]]

###############################################################################
#                            OUTPUT PLUGINS                                    #
###############################################################################


[[outputs.http]]
url = “https://10.10.10.10/arc/default/metric”
insecure_skip_verify = true
tls_ca = “/usr/telegraf/etc/telegraf/ca.cert.pem”
tls_cert = “/usr/telegraf/etc/telegraf/cert.pem”
tls_key = “/usr/telegraf/etc/telegraf/key.pem”
data_format = “wavefront”
[outputs.http.headers]
uuid = “34a739bf-d920-486c-b5f8-a75b4ae74b9b”
ip = “$IP”
All files located in: /usr/telegraf/etc/telegraf/telegraf.d Should be moved out of this directory. You can delete them but i would advise keeping them as backup somwhere.
After this you can restart the telegraf service will the following command:
sudo systemctl restart telegraf
@Jay_Clifford
I really confuse . I attached my telegraf.conf file . Would you please do config in my file and upload there here and say what should I do after that ?
telegraf.tar.gz (71.0 KB)
Hi @baber,
Please refer to the above message. I have already created the new config for you copy and paste this into that telegraf.conf file. The tls certificates and keys refer to your own generated certificates. I have not changed these from the original paths you provided in the original out http plugin.
I would advise reading the administration docs to Telegraf so you can further understand how Telegraf operates as a metrics collection agent. Hopefully this will then make the above instructions clearer.
@Jay_Clifford
I edited my telegraf.conf and now this is my file in follow path :
[root@ptest1 ~]# ll /usr/telegraf/etc/telegraf/
total 576
-rw-r–r-- 1 root root 1306 Nov 18 17:32 ca.cert.pem
-rw-r–r-- 1 root root 3879 Nov 18 17:32 cert.pem
-rw-r–r-- 1 root root 1025 Nov 18 17:32 csr.pem
-rw-r–r-- 1 root root 1675 Nov 18 17:32 key.pem
-rw-r–r-- 1 root root 5881 Dec 13 18:38 telegraf.conf
-rw-r–r-- 1 root root 279204 Dec 13 18:21 telegraf.conf.bak
drwxr-xr-x 2 201 201 6 Dec 13 18:30 telegraf.d
-rw-r–r-- 1 root root 278944 Nov 23 08:54 telegraf.orig.bak
[root@ptest1 ~]# ll /usr/telegraf/etc/telegraf/telegraf.d/
total 0
but when I type
[root@ptest1 ~]# systemctl restart telegraf
Failed to restart telegraf.service: Unit not found.
also when type : /usr/telegraf/usr/bin/telegraf --test -config /usr/telegraf/etc/telegraf/telegraf.conf -config-directory /usr/telegraf/etc/telegraf/telegraf.d &
show attach output
output1.txt (59.9 KB)
@Jay_Clifford
Would you please help me about it ?
@Jay_Clifford
Would you please help me about it ?
This indicates that systemd does not know about the service. How did you install Telegraf?
uhh /usr/telegraf/usr/bin/telegraf??? these are very strange paths. Unless you wrote a custom systemd service file, these paths won’t work by default.
@jpowers
As I am using it and integrate with the other appliance (here I am using vmware vrealize operation) according to follow doc :
at the first step we get a script and run it I atached the script with the name unmanagedagent_setup_sample.sh
after install that I have to run follow command for run telegraf :
/bab/telegraf/usr/bin/telegraf -config /bab/telegraf/etc/telegraf/telegraf.conf -config-directory /bab/telegraf/etc/telegraf/telegraf.d &
How can create it as service for stop and start ?
unmanagedagent_setup_sample.sh.tar.gz (4.4 KB)
