Hi,
I’m using influxdb 1.2.2 to store metrics from Kafka. Each brokers send their metrics every 15 seconds to influx via jmxTrans.
One of the metrics I’m interested in is the number of msg/s for one topic. To get the throughput of that kafka topic for the cluster I need to sum the msg/seconds on each broker for a time period.
For instance, I have 3 servers and that ingest 1/3rd of the data of the topic example.
Server 1: 10 msg/sec
Server 2: 10 msg/sec
Server 3: 10 msg/sec
Total, I should have 30 msg/sec
My problem is that for some reasons, when I query the data I can have:
SELECT sum(oneMinRate) AS sum FROM myRP.kafka_server_topic WHERE cluster = ‘myKafkaCluster’ AND typeName = ‘type=BrokerTopicMetrics,name=MessagesInPerSec,topic=example’ AND time >= ‘2017-12-19T13:07:30Z’ AND time < ‘2017-12-19T13:09:00Z’ GROUP BY time(15s, 0s), cluster
name: kafka_server_topic
tags: cluster=myKafkaCluster
time sum
1513688850000000000 30
1513688865000000000 30
1513688880000000000 30
1513688895000000000 20
1513688910000000000 40
1513688925000000000 30
At the time: 1513688895000000000 one server didn’t store any value and at the next window, I have 2 values.
Steps taken:
JMXTrans try to spread the load and start to collect data at random(15seconds) and then every 15 seconds. This means one server can report the data at seconds 01, 16, 31 and 46. Then another one can report at 14, 29, 44 and 59.
As you can understand, between the trigger and the actual collection time, it can happen 1 seconds and instead of collecting at second 59, it will be at 0.
My mitigation was to narrow down the collection windows. It is now between second 5 and 10.
But this does not work, because influx does not always do the window at 0, 15, 30 and 45, but sometimes at 7, 22, 37 and 52.
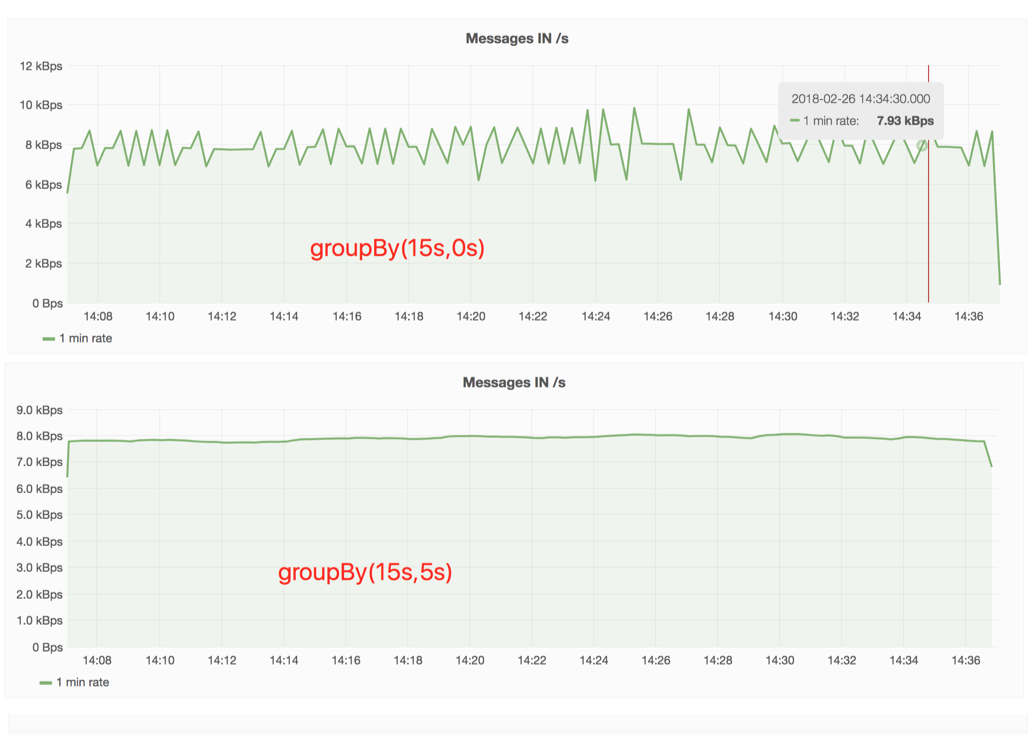
As you can see on the screenshot, if I groupBy(15s) I have all the bumps, but if I groupBy(15s,5s) the charts is right.
My question: Is there a way to force influx to create the time window at 0, 15, 30, 45? The groupby(15s,5s) does not work on each situation, sometimes it is groupby(15s,Ns) where N is between 1 and 14.
Thanks for the help.
