Hi,
currently I’m playing a bit with the dashboards. Many other plotting tools have the ability to (un)hide traces in a figure when clicking on the corresponding item in the legend. Is this possible with the current version of influx as well (and I’m missing the configuration option)?
Hello @atticus-sullivan,
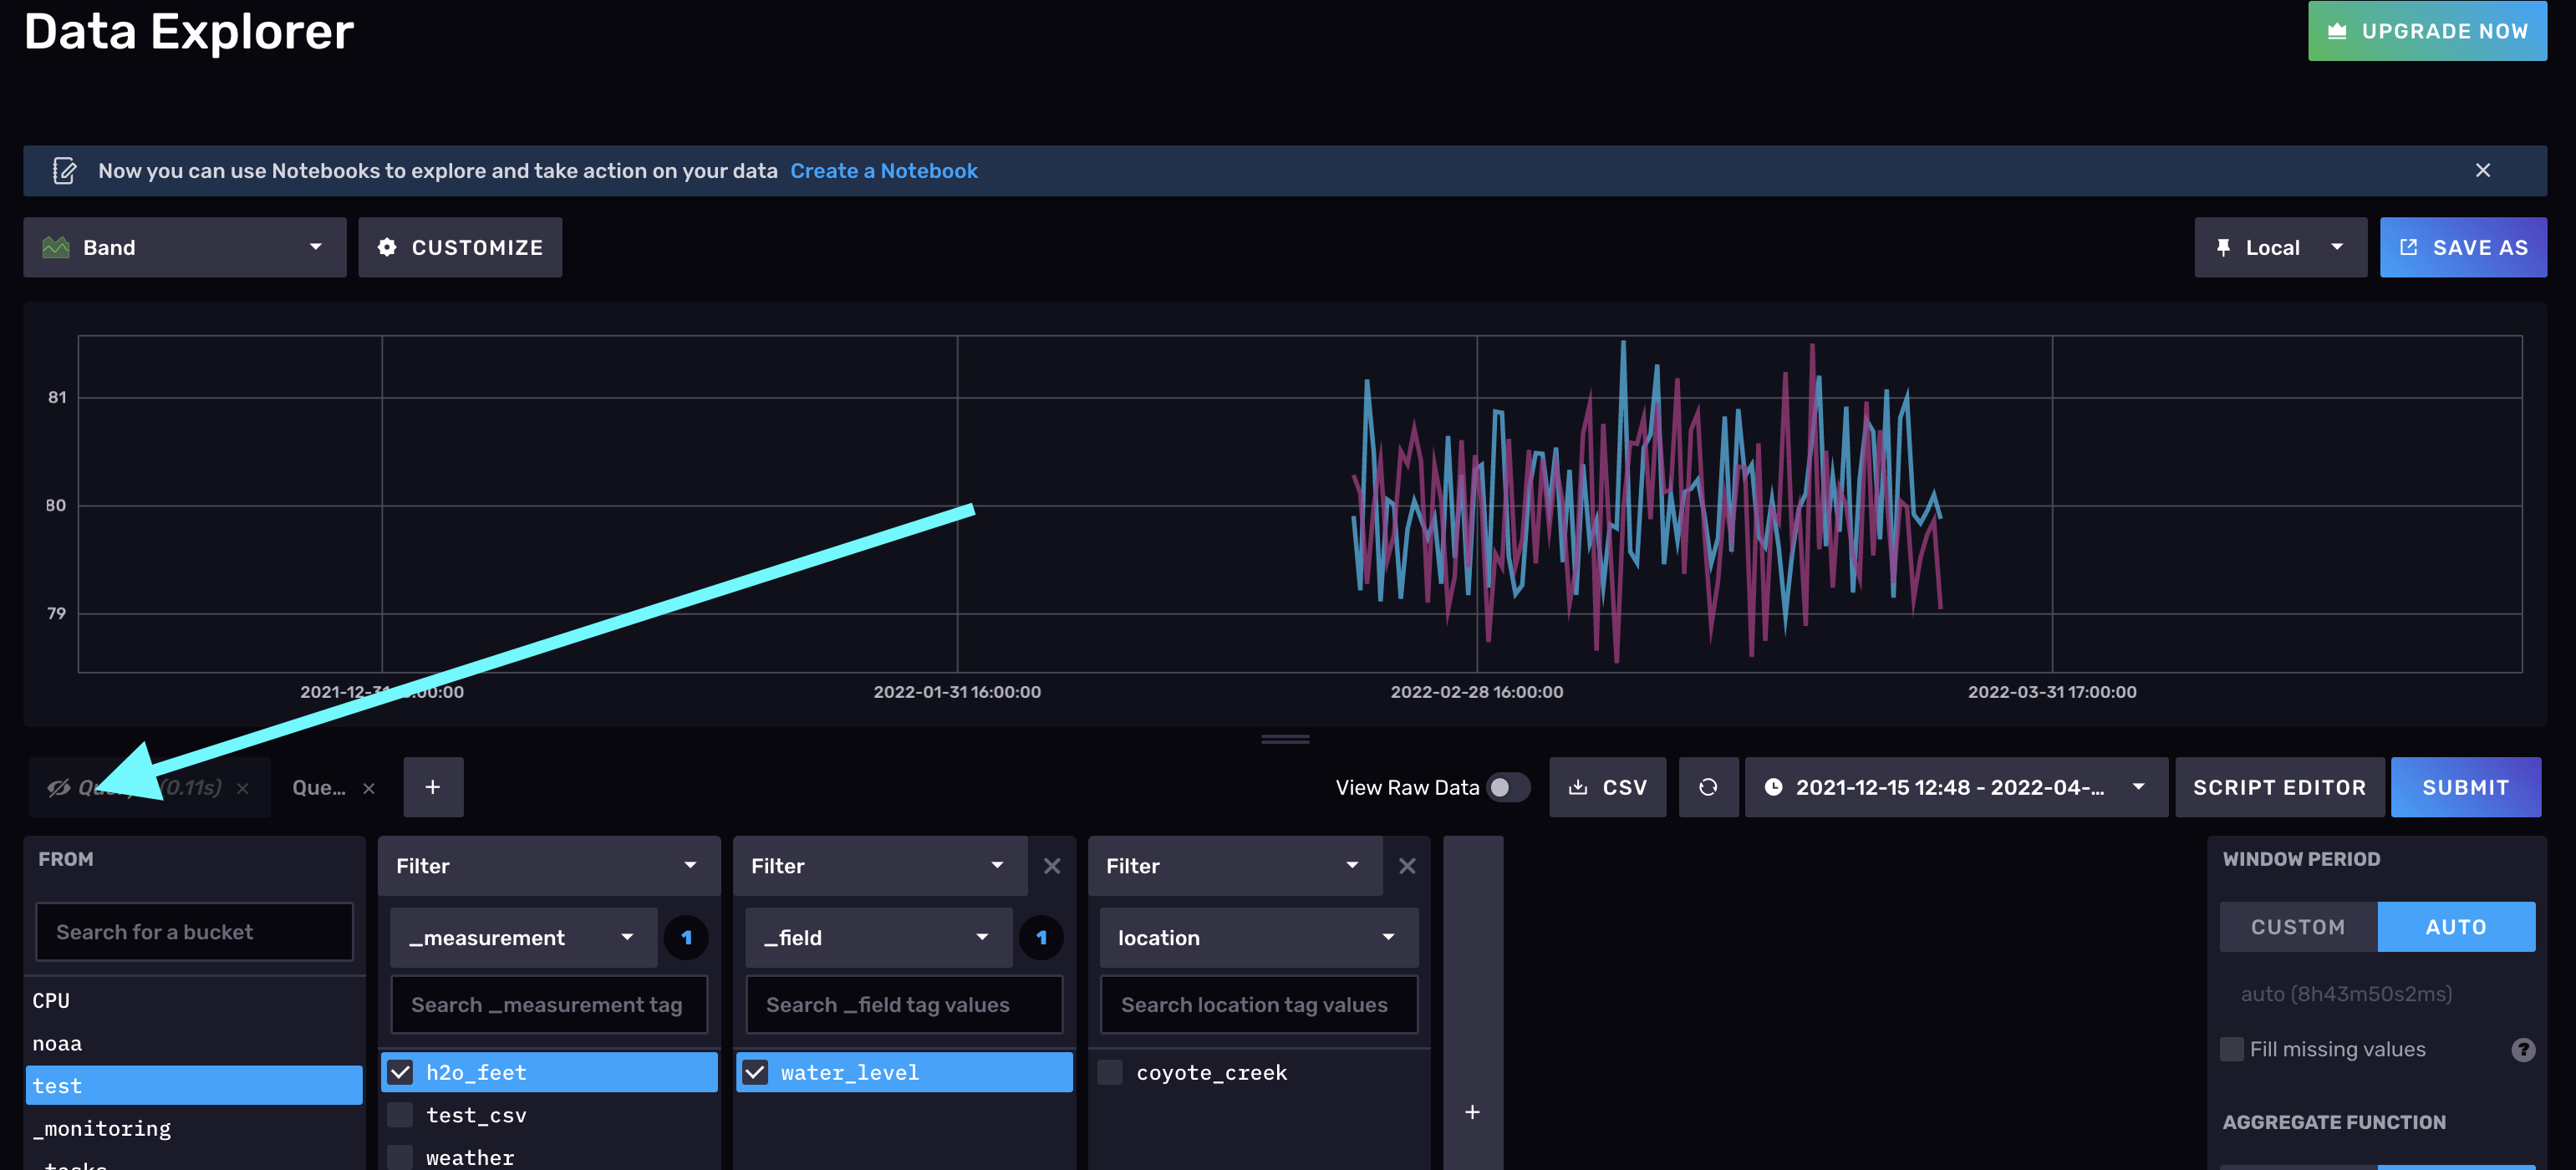
You can hide and unhide tabs in a cell:
I made two tabs in my cell and then used array.form() to display dummy data to “hide” the other data:

However I strongly encourage you to make a feature request here:
