JMU
February 22, 2022, 7:57am
1
Hi, I want to make a dashboard to visualize my InfluxDB Cloud data in Grafana.
First of all, i create a data source of InfluxDB with the next configuration in Grafana
The URL is until orgs/…
After that, I created a dashboard and make the connection with the data source i recently created:
But, nothing happened and it appears the next message: “Expected response data to be array, got undefined” on the top left corner.
Somebody knows how to fix this.
Thank you beforehands
Hi @JMU ,
JMU
February 23, 2022, 10:54am
3
Hi Jay_Clifford,
I don’t understand what you mean about the access token. About Flux, how would it be?
Sorry for the problems
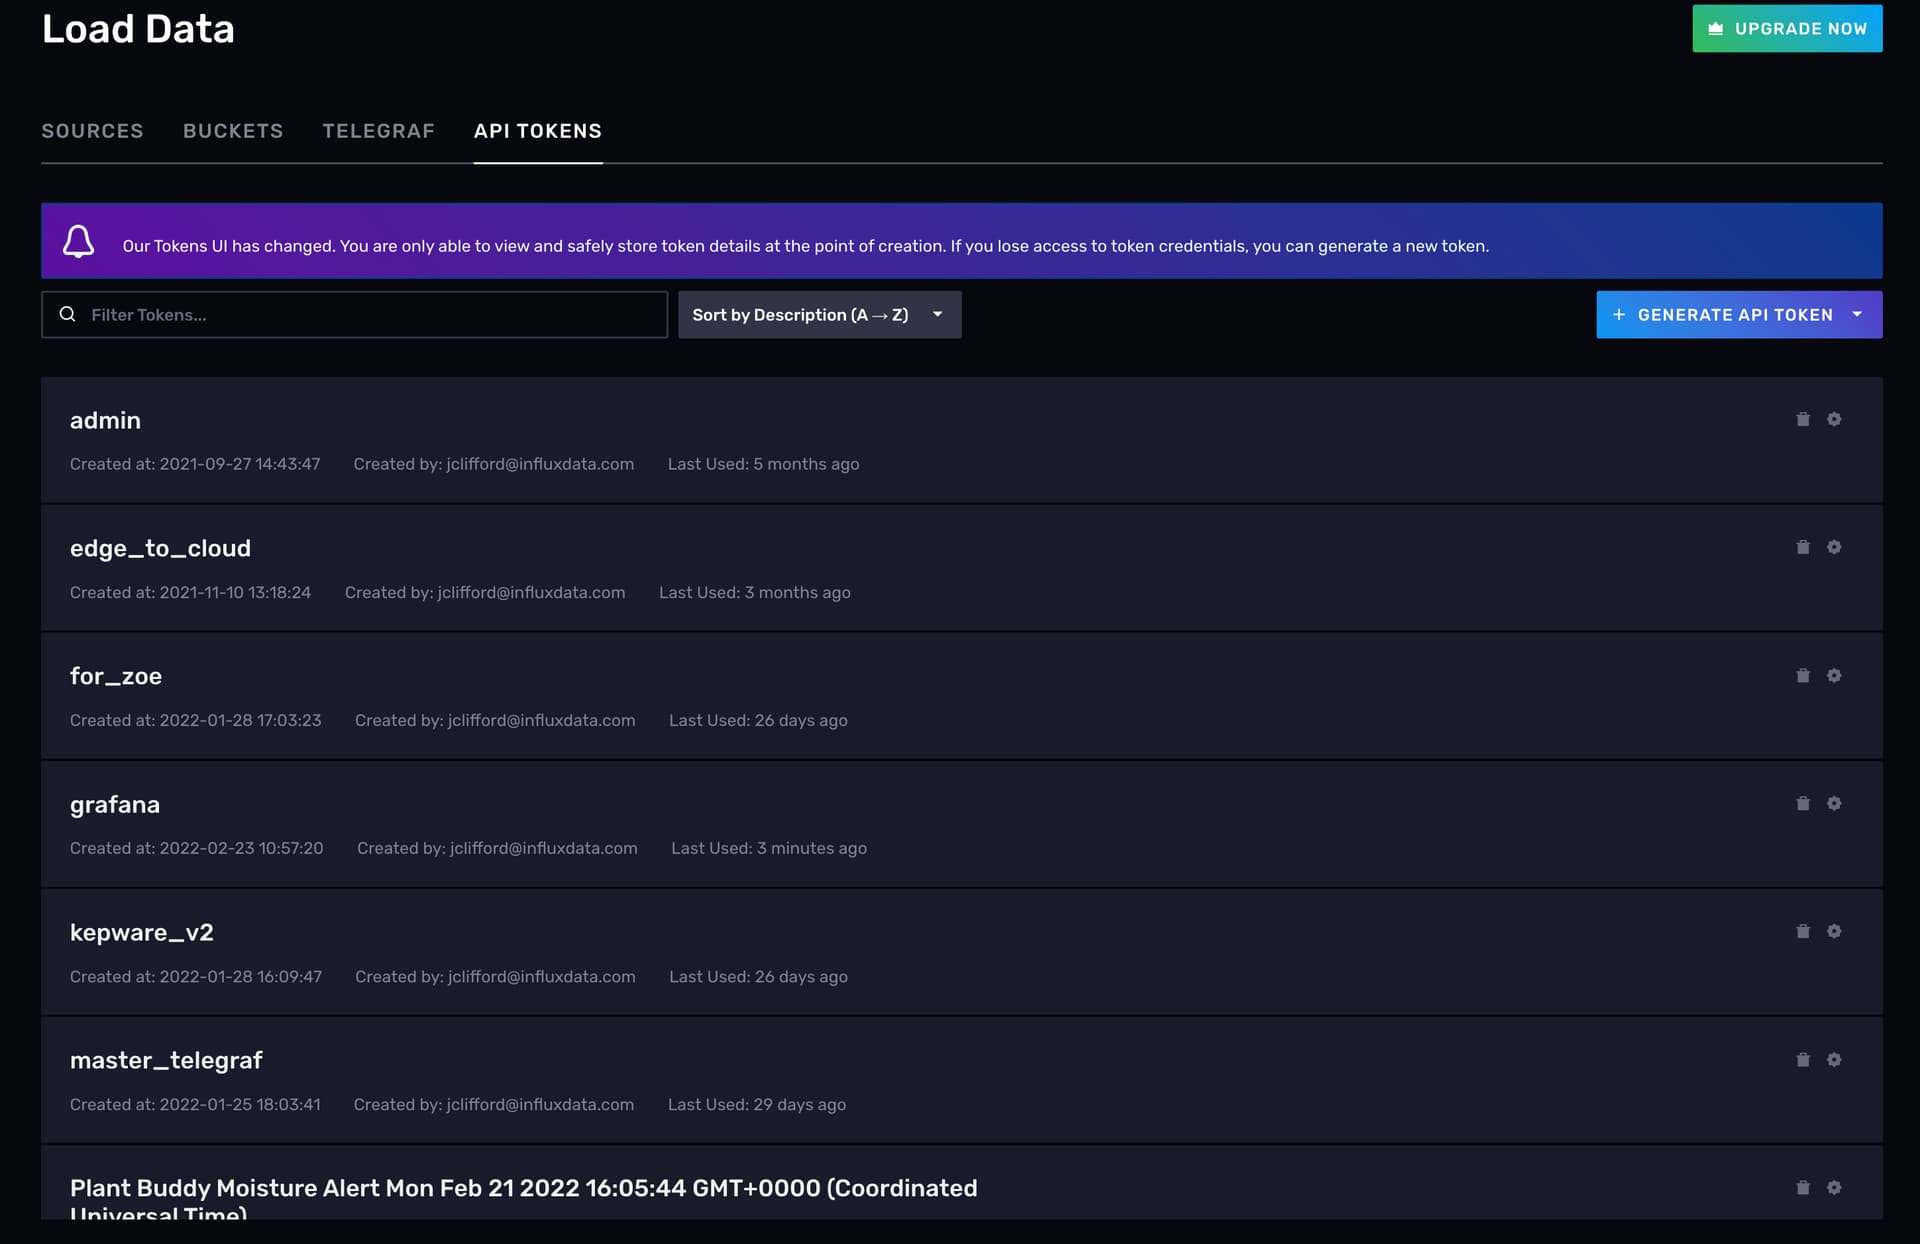
Hi @JMU ,
When using InfluxDB Cloud you require a token to read and write your data to InfluxDB. These are generated from the following panel:
JMU
February 23, 2022, 11:50am
5
I don’t have the option of the query language option neither token nor default bucker.
Really thankful to you Jay
Hi @JMU , sorry for the late reply. What version of Grafana are you using? Can you not see flux in the drop-down list?
JMU
February 24, 2022, 9:58am
7
No worries Jay_Clifford
We have the Grafana v6.4.3.
I can not see the drop-down list
Can you try upgrading to the latest / build greater than 7.1. Flux support was not added till 7.1.
JMU
February 24, 2022, 12:33pm
9
After upgrading to version 8.4.1.
I’ve got the next configuration:
In the token field I write the value of what i have on the variable Influx_token on the environment variable of windows.
However, this message keeps appearing:
Any suggestions?
JMU
February 28, 2022, 9:07am
10
How do I know which is the error?
Maybe watching the logs?
However, I don’t know how to visualize them.
I’m stuck with this problem
Hi JMU, could you try entering the token manually? Just to see if the problem resolves
Thanks,
JMU
February 28, 2022, 11:20am
12
I write it manually and still the same error