I am struggled trying to create a, from my point of view, difficult query. I would appreciate if someone gives me an example that I could use to solve my exercise.
I have the following variables/metrics for a welding operation:
JOBNUMBER: Basically the workorder number, introduced before starting the welding process.
PROCESSACTIVE: Boolean variable, indicating when the welding starts.
VOLTAGE: The realtime voltage of the machine.
POWER: The realtime power of the machine.
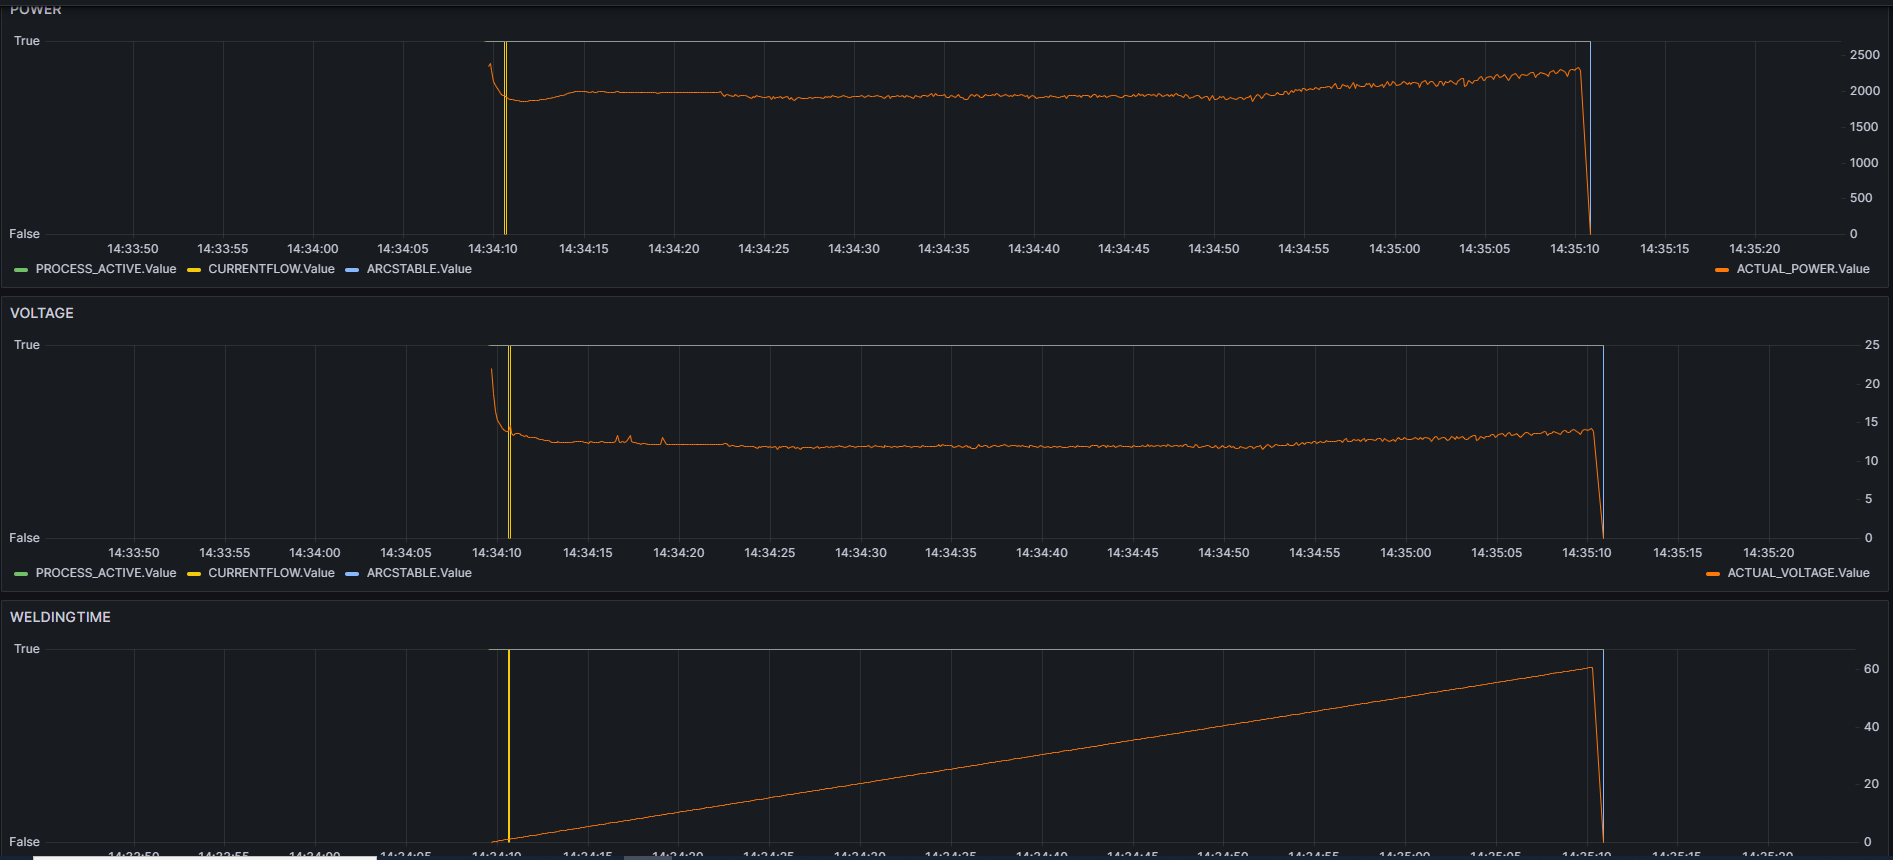
I would like to give the user the possibility to filter the curves by selecting the JOBNUMBER taking into account that the operation needs to be windowed when PROCESSACTIVE is true. An example of welding process can be seen below:
I really appreciate at least one example of an optimized query. As I am trying to learn, I would appreciate to have one example in flux and another in influxql if possible.
I think the steps I should do are:
Create the dropdown filter looking for all the JOBNUMBERS in one timeframe.
Look for the timestamp when PROCESSACTIVE changes from false to true and from true to false to really determine the time filter of the operation.
Filter the voltage and power based on the window determined before.
Hello,
few questions:
-so jobnumber is not a tag on the other data ?
-process active is only write when it change of state ?
-final purpose: just display the time series of voltage and power ?
jobnumber is not a tag, it is a metric like the others.
process active only writes when changing from true-false-true.
final purpose: To have a dropdown on top of the screen allowing user to display exactly the curves associated to each jobnumber. Basically, you need to detect the timeframe associated to each jobnumber when processactive=true.
Don’t hesitate to ask more questions in case of doubts.
So to be sure, your data are like, sorted by timestamp:
timestamp_1,field=jobnumber,value=[workordernumber]
timestamp_2,field=processactive,value=TRUE
timestamp_3,field=voltage,value=XX
timestamp_3,field=power,value=XX
timestamp_N,field=voltage,value=XX
timestamp_N,field=power,value=XX
timestamp_N+1,field=processactive,value=FALSE
Hello @alex1510,
How are you identifying when the timestamp is true or false? Based on your line protocol, it looks like they’re just plain timestamps without a tag to identify them as true or false.
Just to make sure you’re looking to bucket your time into windows where the start time of the bucket is a “true timestamp” and the end of the window is a false timestamp?
Unfortunately I can’t think of a good way to perform this type of custom windowing with Flux. This is the best I can think of.
Lets assume youre identifying the true and false timestamps by a tag:
//create a cumulative sum for the true timestamps:
from(bucket: "yourBucket")
  |> range(start: -1d)
  |> filter(fn: (r) => r._measurement == "yourMeasurement" && r._field == "yourField")
  |> map(fn: (r) => ({
      r with
      status: r.status,
      statusCount: if r.status == "true" then 1 else 0
    }))
  |> cumulativeSum(columns: ["statusCount"])
So…
Given the example Flux code provided, let’s break down what the output would look like. The code aims to transform a dataset by incrementing a count every time a “true” value appears in the status column. The transformation involves first converting the “true”/“false” values to numerical values (1 for “true”, 0 for “false”) and then applying a cumulative sum on these values to get a running total of “true” statuses.
Assuming your original dataset in a measurement looks something like this:
_time
status
2023-01-01T00:00:00Z
true
2023-01-01T01:00:00Z
false
2023-01-01T02:00:00Z
true
2023-01-01T03:00:00Z
true
2023-01-01T04:00:00Z
false
After applying the provided Flux transformation, the output would add a statusCount column that represents the cumulative sum of “true” values up to that point:
_time
status
statusCount
2023-01-01T00:00:00Z
true
1
2023-01-01T01:00:00Z
false
1
2023-01-01T02:00:00Z
true
2
2023-01-01T03:00:00Z
true
3
2023-01-01T04:00:00Z
false
3
So now you can just group() by your statusCount and then filter for your other required tag, JOBNUMBER. Or you might want to filter for JOBNUMBER first. I’m not exactly sure how that would affect your output as I’m not entirely clear what your input looks like and what your requiremetns are.
Thank you for the reply and explanation but I don’t really understand the transformations you perform.
What I want to do is just offer a user the possibility to filter the welding by its JOB NUMBER when PROCESSACTIVE is true. To do so, I need a query able to retrieve the current and power only for the period between PROCESSACTIVE true and again false…normally around 1min. The idea is just to generate the report of each welding operation.
From your query I don’t understand why you count status. You also mentioned tags when…as you see…I don’t have any relevant tag that helps to filter.