Hey,
I’m trying to chart power consumption.
Power usage is stored in Wh.
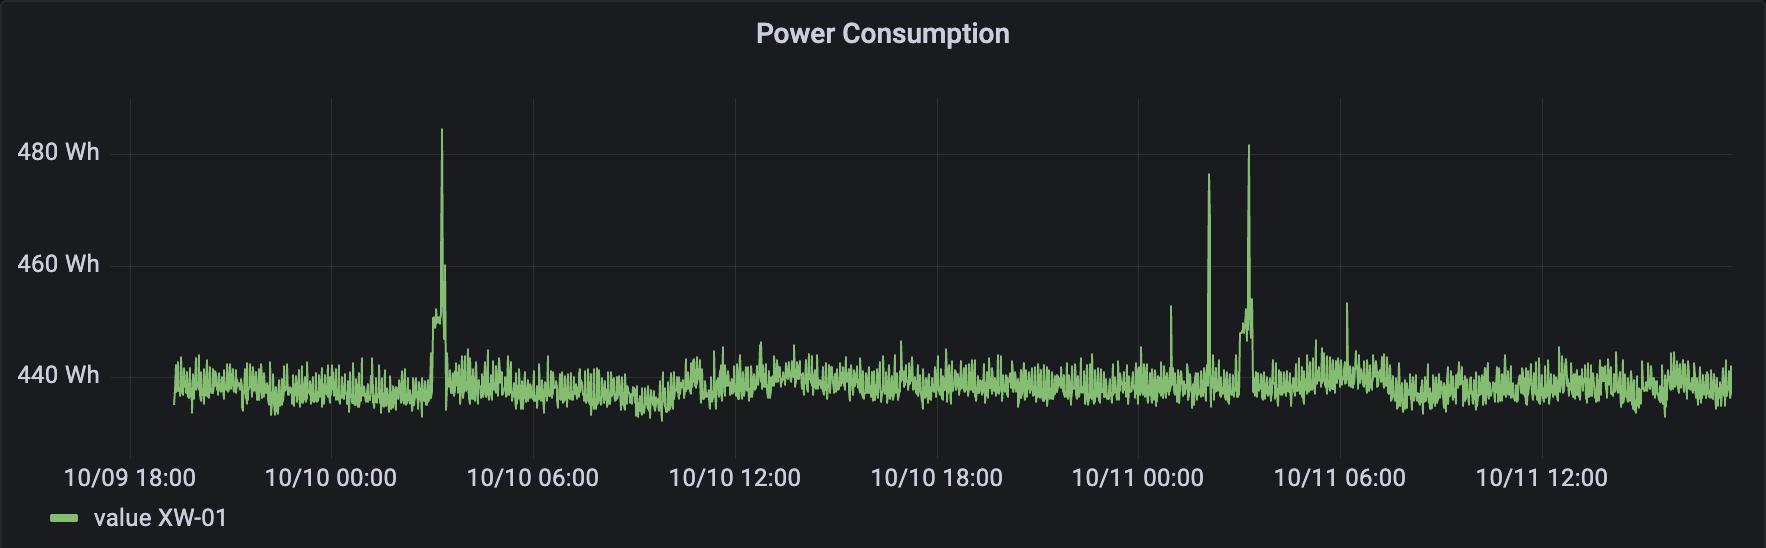
I can easily chart usage to view the raw data.
I’ve aggregated the data in 1h time frame so that I can see the usage per hour.
from(bucket: "power")
  |> range(start: v.timeRangeStart, stop:v.timeRangeStop)
  |> filter(fn: (r) =>
    r._measurement == "Rack_1A" and
    r._field == "value"
  )
  |> aggregateWindow(every: 1h, fn: mean)
Now, what I want to do is to sum the hours (all the points in the previous chart) to have multiple subsequent chart (daily, weekly, monthly).
Anyone have an idea?
R,
xk3tchupx
Hi @xk3tchuPx,
So there are a few ways you could do this. The easiest way would be to use another aggregate window.
from(bucket: "power")
  |> range(start: -7d)
  |> filter(fn: (r) =>
    r._measurement == "Rack_1A" and
    r._field == "value"
  )
  |> aggregateWindow(every: 1h, fn: mean)
  |> aggregateWindow(every: 1d, fn: sum)
The above function sums all points within one day over a 7-day period. The second option is just to apply the sum() function though This would just total all points within your specified range.
from(bucket: "power")
  |> range(start: -7d)
  |> filter(fn: (r) =>
    r._measurement == "Rack_1A" and
    r._field == "value"
  )
  |> aggregateWindow(every: 1h, fn: mean)
  |> sum()
This would sum together all aggregated points