How would I write this stateDuration function to count the yellow faults duration if previous state = “RunPQ-Auto” (in green). Is there a way to do this? Thank you so much!! @Anaisdg@scott
@Marion_Akagi I’m not sure there’s a way to do this with Flux as it currently stands. The tricky part is grouping by “fault cycles” and then only computing the duration of relevant fault cycles. There’s a proposed feature for Flux that, if added, this would be totally doable.
Unfortunately, I don’t when or if this will ever be added .
This is as close as I can get, which will prob work once I put the query in Grafana and can filter out some rows. Actual_new and prev_record_new and downtime minutes are the only columns I need (the other two are there b/c I had to do an aggregate window and couldn’t do that based on strings). So, of these three rows, I would keep only the second one. I can see what the prev value was (RunPQ-Auto) and the current fault value and the downtime. Looking forward to a more straight forward way to do this in the future.
Actually, looking at your data structure that you screenshotted in your original post, there might be a way to do it. I’d recommend using the events.duration() function.
Filter by only records where the current state does not equal the previous state.
Use events.duration() to calculate the duration between the state cycles.
Filter by records where previous state is RunPQ-Auto and current state is some variant of FalutN.
import "contrib/tomhollingworth/events"

// data just represents the data from your screenshot
data
    |> filter(fn: (r) => r["current state"] != r["previous state"])
    |> events.duration(unit: 1m, stop: now())
    |> filter(fn: (r) => r["previous state"] == "RunPQ-Auto" and r["current state"] =~ /^Fault[0-9]+$/
@scott Interesting, so that filters down to the correct rows I need but it’s not calculating the duration correctly. Is it possible instead to grab the start and stop timestamps of the faults and then calculate the duration? The issue now is the events.duration is calculating the minutes until the next row starts. But we have the right rows in the results so that’s a start!
Sure! Here it is, and this is the output below also.
import "experimental/query"
import "influxdata/influxdb/monitor"
import "contrib/tomhollingworth/events"
import "date"
import "strings"
import "join"

//left side of join which outputs _time, and a field called "Actual", which is a concatenation of InvStatus and RunMode
left = from(bucket: "test-fault-data")
  |> range(start: v.timeRangeStart, stop: v.timeRangeStop)
  |> filter(fn: (r) => r["_measurement"] == "unit")
  |> filter(fn: (r) => r["point_name"] == "InvStatus" or r["point_name"] == "RunMode")
  |> filter(fn: (r) => r.unit_controller_id == "0215D26C-10")
  |> truncateTimeColumn(unit: 1m)
  |> map(fn: (r) => ({ r with concat: r.InvStatus+"-"+r.RunMode }))
  |> map(fn: (r) => ({ r with string: string(v: r.point_name) }))
  |> group()
  |> pivot(rowKey:["_time"], columnKey: ["string"], valueColumn: "_value")
  |> map(fn: (r) => ({ r with concat: r.InvStatus+"-"+r.RunMode }))
  |> keep(columns: ["concat", "_time"])
  |> sort(columns: ["_time"], desc: false)
  |> rename(columns: {concat: "_value"})
  |> rename(columns: {_value: "actual"})

//right side of join which is the same as left, except time shifted 1min to get 'prev_record' on the same row as 'actual'
  right = from(bucket: "test-fault-data")
  |> range(start: v.timeRangeStart, stop: v.timeRangeStop)
  |> filter(fn: (r) => r["_measurement"] == "unit")
  |> filter(fn: (r) => r["point_name"] == "InvStatus" or r["point_name"] == "RunMode")
  |> filter(fn: (r) => r.unit_controller_id == "0215D26C-10")
  |> truncateTimeColumn(unit: 1m)
  |> map(fn: (r) => ({ r with concat2: r.InvStatus+"-"+r.RunMode }))
  |> map(fn: (r) => ({ r with string: string(v: r.point_name) }))
  |> group()
  |> pivot(rowKey:["_time"], columnKey: ["string"], valueColumn: "_value")
  |> map(fn: (r) => ({ r with concat2: r.InvStatus+"-"+r.RunMode }))
  |> keep(columns: ["concat2", "_time"])
  |> sort(columns: ["_time"], desc: false)
  |> timeShift(duration: 1m, columns: ["_time"])
  |> rename(columns: {concat2: "_value"})

//join left and right
join.time(method: "full", left: left, right: right, as: (l, r) => ({l with prev_record: r._value}))

//this is the query I addded per your earlier comment.  Like I mentioned, the duration output is the whole time between rows, not just the fault time
    |> filter(fn: (r) => r["prev_record"] == "RunPQ-Auto" and r["actual"] =~/Fault/)
    |> events.duration(unit: 1m, stop: now())
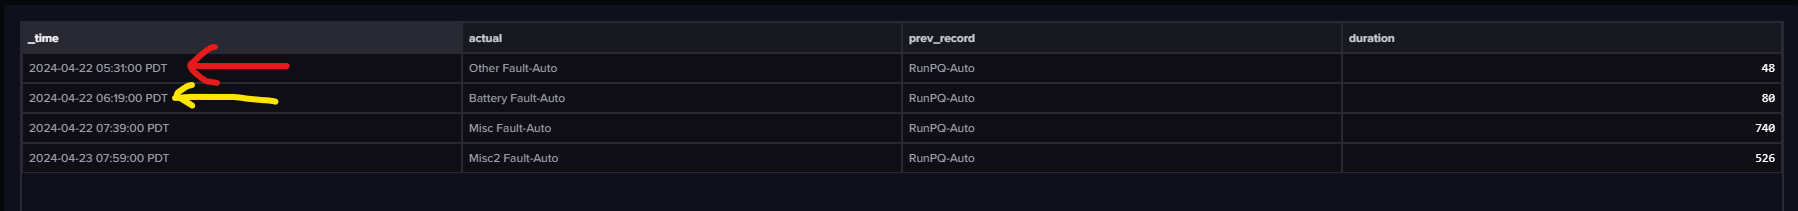
This below is the duration I’m trying to get to from the first row in the above table. Right now, the duration lasts until the second record in the above table (yellow arrow).