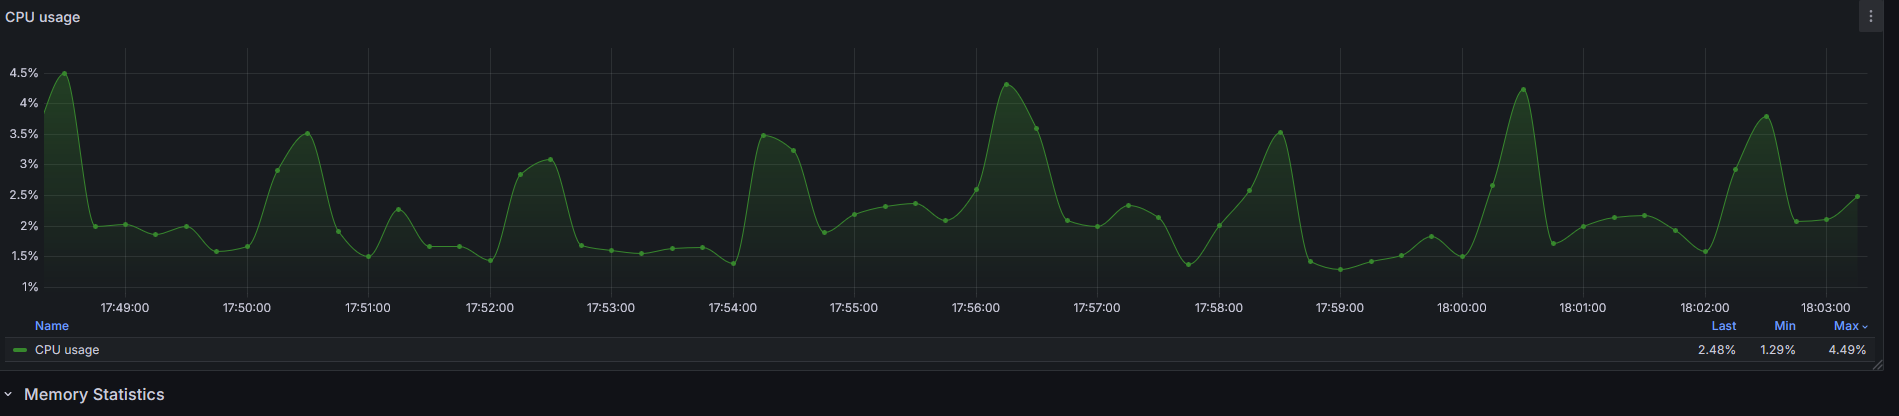
I am newbie with Influxdb ,just migrated from Prometheus, i have influxdb 3 , i am trying to create time cpu and the graph looks weird, i can get it look coherent (dont know if its the right world )
Perhaps a better question for Grafana forum, but firstly ensure the SQL query is returning all the data correctly before plotting that using graph. Then make sure Grafana component and variables are correctly setup.