I’m trying to create/synthesize a new column containing the total of a series after a sum() operation.
This is what my data looks like after calculating/grouping the daily power consumption of number of different UPSs.
intervals=from(bucket: "ups")
 |> range(start: v.timeRangeStart, stop: v.timeRangeStop)
 |> filter(fn: (r) => r["_measurement"] == "nutgraf_ups_data")
 |> filter(fn: (r) => r["_field"] == "nutgraf.ups.realpower")
 |> aggregateWindow(every: 1d, fn: integral, createEmpty: false)
 |> map(fn: (r) => ({r with _value: r._value / 3600000.0 }))
 |> keep(columns: ["_value", "_time", "_field", "nutgraf.ups.name"])
looks like
Then I try to total the series
summed = intervals
|> pivot(rowKey:["_time"], columnKey: ["_field"], valueColumn: "_value")
|> group(columns: ["_time"])
|> sum(column: "nutgraf.ups.realpower")
|> group()
|> map( fn: (r) => ({r with _value: r["nutgraf.ups.realpower"], _field: "nutgraf.ups.realpower", "nutgraf.ups.name": "TOTAL"}))
|> keep(columns: ["_value", "_time", "_field", "nutgraf.ups.name"])
However, when charting this summary, the ‘synthetic field’ I tried created doesn’t show up, really, no fields show up at all. They show up in the datatable, but they do not render in a chart.
My intention is to combine these two tables at the end to mix in the total with the other two series…
union(tables: [intervals,summed])
Ok, replying to myself here… I think I figured it out a bit more… I restructured my summed function to be a little more simple.
interval=from(bucket: "ups")
 |> range(start: v.timeRangeStart, stop: v.timeRangeStop)
 |> filter(fn: (r) => r["_measurement"] == "nutgraf_ups_data")
 |> filter(fn: (r) => r["_field"] == "nutgraf.ups.realpower")
 |> aggregateWindow(every: 1d, fn: integral, createEmpty: false)
 |> map(fn: (r) => ({r with _value: r._value / 3600000.0 }))
 |> keep(columns: ["_value", "_time", "_field", "nutgraf.ups.name"])

summed = interval
|> group(columns: ["_time"])
|> sum()
|> group()
|> map( fn: (r) => ({r with "nutgraf.ups.name": "TOTAL"}))

union(tables: [interval,summed])
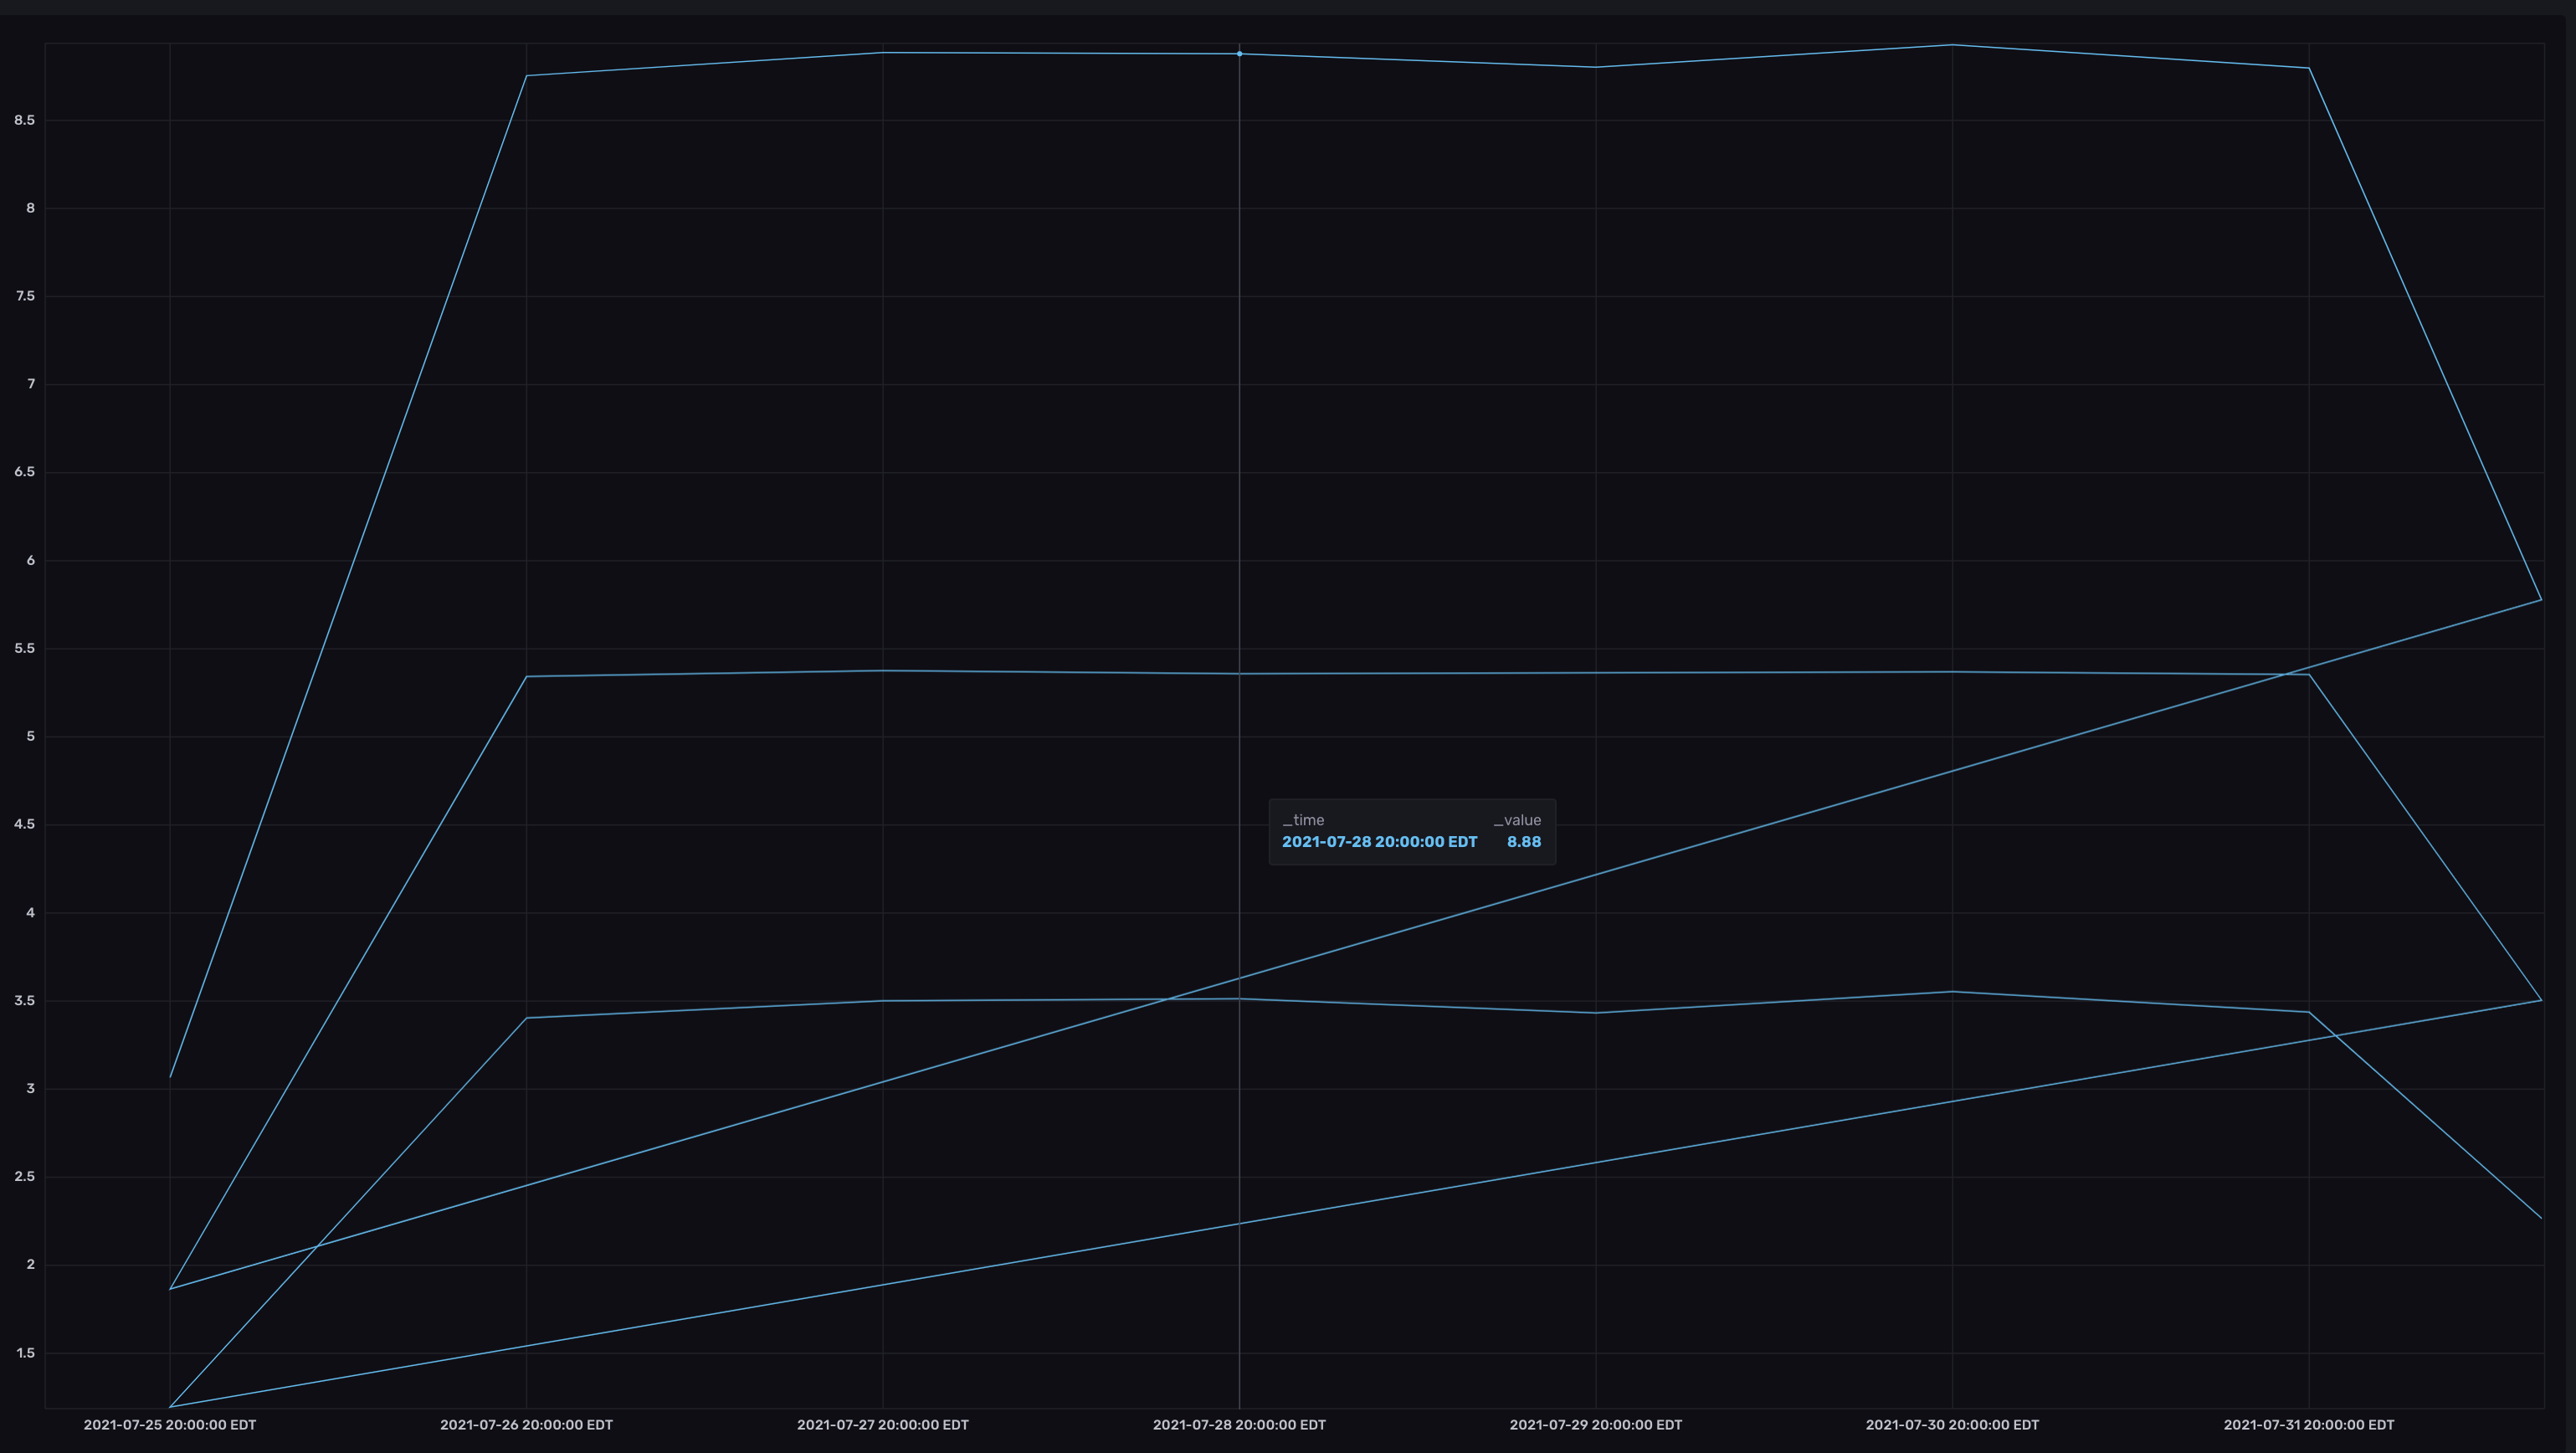
Final result looks good!
Unfortunately, I still lose the name of the “_field” because I guess the sum() that produced the row didn’t add a _field column, and so its permanently “unnamed”.
Maybe the sum() function could be modified so that you could specify the name of the “_field” (or i guess “column”, depending on POV)?
It also seems kinda arbitrary that “r with X” works when X is “_value”, but not when it is “_field”.
Hello @midzelis,
The r with syntax works with anything. What’s happening is that when you group by time only you’re removing the field as a part of the group key so when you apply sum that column is removed.
Try
|> group(columns: ["_time", "_field"])
Or you could add a column back with |> map( fn: (r) => ({r with "_field": "nutgraf.ups.realpower"})) or by using the set() function (not as efficient)
This is the exact thing that isn’t working. When I do this, and if i view the results in “raw data” mode, it shows the field.
However, when I try to chart it, it goes wild…
compared to how it looks like without
|> map( fn: (r) => ({r with "_field": "nutgraf.ups.realpower"}))
I also tried adding changing the group to be
|> group(columns: [“_time”, “_field”])
But it also resulting in the wild graph (at least in influxdb, it seems to work kinda in Grafana…)
But now, in Grafana, the name of the “series” is getting lost…
They seem to be coming back as one “Table” instead of 3 Tables…
Hello @midzelis,
Can you please share the input data the data as annotated CSV please? I’d like to try your script
interval=from(bucket: "ups")
 |> range(start: v.timeRangeStart, stop: v.timeRangeStop)
 |> filter(fn: (r) => r["_measurement"] == "nutgraf_ups_data")
 |> filter(fn: (r) => r["_field"] == "nutgraf.ups.realpower")
 |> aggregateWindow(every: 1d, fn: integral, createEmpty: false)
 |> map(fn: (r) => ({r with _value: r._value / 3600000.0 }))
 |> keep(columns: ["_value", "_time", "_field", "nutgraf.ups.name"])

summed = interval
|> group(columns: ["_time"])
|> sum()
|> group()
|> map( fn: (r) => ({r with "nutgraf.ups.name": "TOTAL"}))

union(tables: [interval,summed])
on my machine to dig into what might be happening with Flux.
I’m wondering if it’s something weird with the group key?
I wonder if you group by field and nutgraf.ups.name if it’ll change the visualization at all.
Otherwise this looks like a bug. Because if you have multiple tables in your stream the visualization should reflect that.
I’d encourage you to submit an issue. That would be super helpful!
Grouping by time and field should return the data as 3 tables with the field in the group key. Hence why I’d like to play with your data to understand what’s happening. You can export your starting data to Annotated CSV from the UI in the Data Explorer after you’ve submitted your query.
@midzelis,
Thank you for that!
Hello @midzelis,
Thanks for making the issue and including the csv. It really helped me identify the problem.
The following worked for me:
interval=from(bucket: "test")

|> range(start: v.timeRangeStart, stop: v.timeRangeStop)

|> filter(fn: (r) => r["_measurement"] == "nutgraf_ups_data")

|> filter(fn: (r) => r["_field"] == "nutgraf.ups.realpower")

|> aggregateWindow(every: 1d, fn: integral, createEmpty: false)

|> map(fn: (r) => ({r with _value: r._value / 3600000.0 }))

|> keep(columns: ["_value", "_time", "_field", "nutgraf.ups.name"])

// |> yield(name:"interval")

summed = interval

|> group(columns: ["_time"])

|> sum()

|> map( fn: (r) => ({r with "nutgraf.ups.name": "TOTAL", "_field": "nutgraf.ups.realpower"}))

|> group(columns: ["nutgraf.ups.name", "_field"])

|> yield(name:"summed")

union(tables: [interval,summed])
So the issue is around the sum() function which is a bare aggregate. It will only leave columns in the group key. Since you group by time everything else is removed from the group key and so it’s left out. You can group by time to sum across your tag but you might also want to try a pivot:
interval=from(bucket: "test")
 |> range(start: v.timeRangeStart, stop: v.timeRangeStop)
 |> filter(fn: (r) => r["_measurement"] == "nutgraf_ups_data")
 |> filter(fn: (r) => r["_field"] == "nutgraf.ups.realpower")
 |> aggregateWindow(every: 1d, fn: integral, createEmpty: false)
 |> map(fn: (r) => ({r with _value: r._value / 3600000.0 }))
 |> keep(columns: ["_value", "_time", "_field", "nutgraf.ups.name"])
//  |> yield(name:"interval")

summed = interval
  |> pivot(rowKey:["_time"], columnKey: ["nutgraf.ups.name"], valueColumn: "_value")
  |> map(fn: (r) => ({ r with _value: r.APC + r.CP1500 }))
  |> map( fn: (r) => ({r with "nutgraf.ups.name": "TOTAL"}))
  |> yield(name:"summed")

union(tables: [interval,summed])