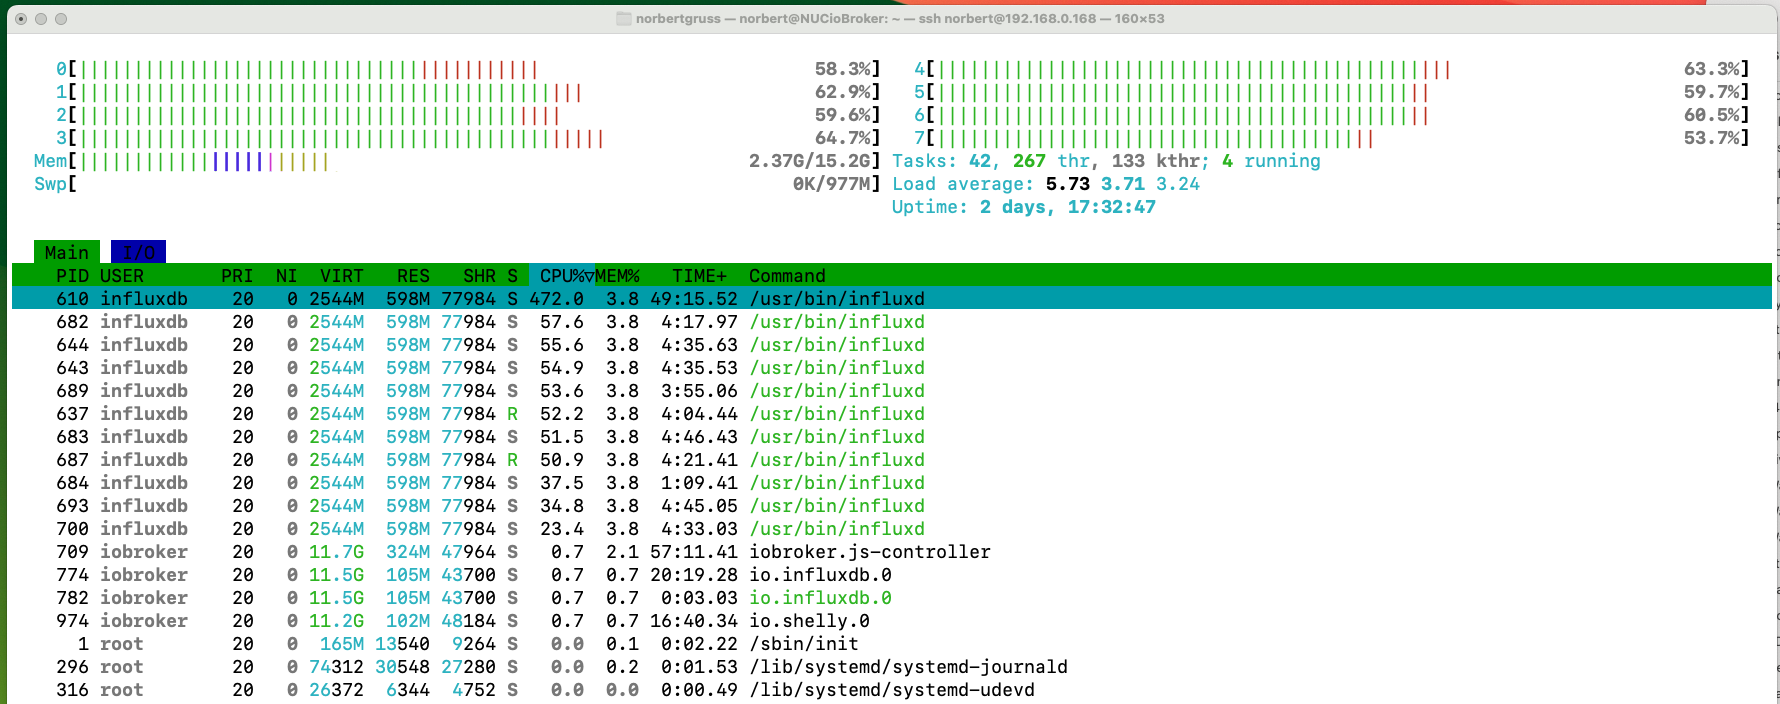
Since an linux update middle July, using my Vis in Iobroker ( Influxdb2 >> Grafana ) there is much heating on my Computer most of the Influx-Processes ( about 10 ) running towards 50% or higher CPU usage
After the update, I have made a new bucket in Influxdb and startet logging in the new bucket.
I cleared and deleted the old one.
There are about 100000 values, I think it’s not so much. No positive Result.
Until this update there had been not problems with heating or so.
My Main Energy Measurement holds about 120000 values until this Date in middle July.
Could it be that other programs are causing the high CPU usage ? You can monitor that in your operating system. Those numbers are not that high but it could also be that Grafana dashboard are complicated with queries that eating up CPU. You can try to simplify or stop the charts and graphs to narrow down the cause.
Yes, the first one is quite high. Did something change recently - like you upgraded/downgraded the version or now executing complex queries ? It might be worth trying another version.
As I wrote, there was an linux update , and an influxdb update ( 14.07.2024 )
When realizing this problem ( fan ran louder ) I made a new bucket and cleared the old one ( saving most of the data ) The old bucket has then deleted.
Nothing changed after that. So I don’t know what to do.
I have two identical queries on a Grafana dashboard, since the problem started, the 2nd query (the last 12 months) takes 6-8 times longer than the 1st query, which covers the previous period.
???