Currently I’m trying todo smth that is done in Chronograf “Host List”. So, to have a list of hosts and it’s status even if machine is down and there is no data into some measurements(let say system) still show the host and maybe set some status. Now, a query like this works ok:
SELECT last("usage_idle") * -1 + 100 as "cpu_usage" FROM "cpu" WHERE ("cpu" = 'cpu-total') AND time > now() - 1m GROUP BY host
But when there will be no data host will not be shown. I guess I need to combine 2 queries, first run smth like this:
SHOW TAG VALUES FROM /win_system|system/ WITH KEY = "host"
and after that combine this with the above query to have what I need, but not sure yet.
Is this possible, can anyone guide me into right direction?
The same thing here, trying to find a way on Internet.
Hi,
My configuration is based on: Telegraf + InfluxDB + Grafana, I’m not using Kapacitor, Cronograf.
For this notification aspect is a way to have in Grafana if I’m not using Kapacitor, Cronograf?
[Server side]
telegraf-1.5.0-1.x86_64
grafana-4.6.3-1.x86_64
influxdb-1.4.2-1.x86_64
I’m trying something like in Nagios | Centreon, to have on home page all Services that are in WARNING/ CRITICAL status, somehow a filtering in order to see only the problems.
It is feasible/ possible to have on the same Dashboard(with template or without template) where you have the services KPIs a top row where you can have some notifications panels (singlestat, etc) where you can see the services in WARNING/ CRITICAL status?
Or is needed to have a separate Dashboard for this?
Any recommendation or docs for this, really appreciated.
It’s possible to show the nodes in a separate column? I also want to be able to click on specific node and check mode details, I did it like like this:
I’ll respond to your question, I’m not sure that will fit your needs because I didn’t understand exactly what you need to obtain as a final request, it will be great if you detail a little bit the needs.
After I’ve stopped telegraf on VM.
1). Please detail.
2).
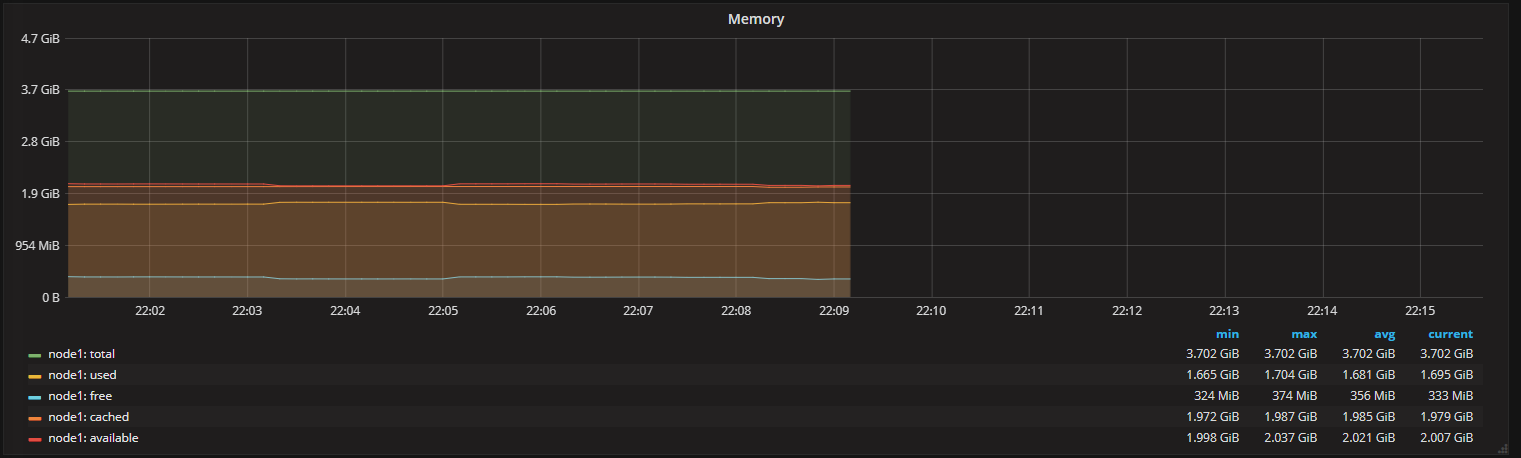
In my case I use a Dashboard for multiple servers and I have used “panel”:
Singlestat, Graph in most of the cases like in the picture below.