I have this datastructure:
|Hosts   | Status | Time |
|Host A |     0      |  a  |
|Host A |     1      |  b   |
|Host A |     0      |  c   |
|Host B |     0      |  a  |
|Host B |     0      |  b  |
|Host B |     0      |  c  |
and so on…
Where 0 is OK and 1 is CRIT state.
Now - in Grafana I want to have a STATE-TIMELINE showing only hosts with Problems in the last x hours.
Right now I have this query:
from(bucket: "XYZ")
  |> range(start: v.timeRangeStart, stop: v.timeRangeStop)
  |> filter(fn: (r) => r["_field"] == "service_state")
  |> filter(fn: (r) => r["service_description"] == "Check_MK")
  |> aggregateWindow(every: v.windowPeriod, fn: mean, createEmpty: false)
  |> filter(fn: (r) => r._value != 0 )
  |> keep(columns: ["host_name","_time", "_value"])
  |> yield(name: "mean")
Now the problem with this query is that it filters out ALL 0 states. That means a recovery for a problem host is lost.
Which results in the following:
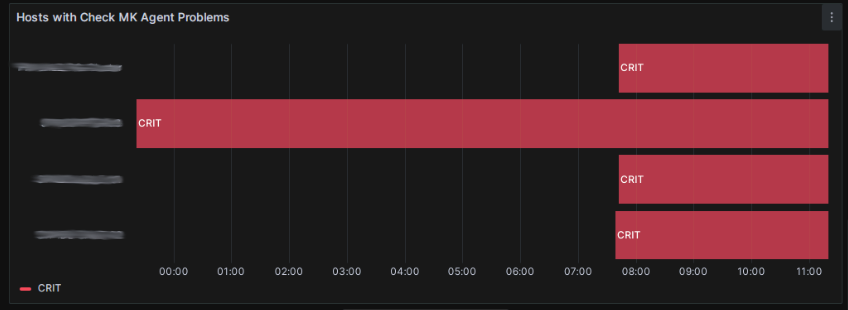
What I want is the all hosts with problems are shown in state-timeline but recovery records(state 0) should not be dropped.
In SQL I would solve this with a subquery. In Flux I have no clue how to fix this.