Hi,
Can someone let me know influxdb query to display filesystem size in Gigabyte(used,total,free)?
Also in grafana i can see min.max,avg values instead i would like to display total,used,free value in GB.
I am using linux based nodes.
ReagrdsKumar
Hi,
Can someone let me know influxdb query to display filesystem size in Gigabyte(used,total,free)?
Also in grafana i can see min.max,avg values instead i would like to display total,used,free value in GB.
I am using linux based nodes.
ReagrdsKumar
Hi,
Can someone let me know influxdb query to display filesystem size in
Gigabyte(used,total,free)?
What units are you putting the filesystem sizes into InfluxDB in?
If it’s bytes, you probably want to divide the number by either 1,000,000,000
or else 1,073,741,824 depending on what your definition of “Giga” is.
Also in grafana i can see min.max,avg values instead i would like to
display total,used,free value in GB.
Do you have separate fields in Influx for these items? If so, just query for
that field in Grafana, and that’s the value you’ll get.
Antony.
Hi,
I just uses below query in grafana panel which provides utilized percent same like expecting free,used,total sized in GB.
SELECT mean(“used_percent”) AS “used_percent” FROM “disk” WHERE (“host” = ‘node1’) AND $timeFilter GROUP BY time($interval), “path”, “device”, “fstype” fill(null)
Regards
Kumar
Not sure the disk plugin gives you Free GB as such. You could
a) convert it using tick script and write it back to your measurement (field names might be off slightly)
|eval(lambda: “Free_Megabytes” / 1024.00,
lambda: “Percent_Free_Space”)
.as(‘Free_Megabytes’,‘Percent_Free_Space’)
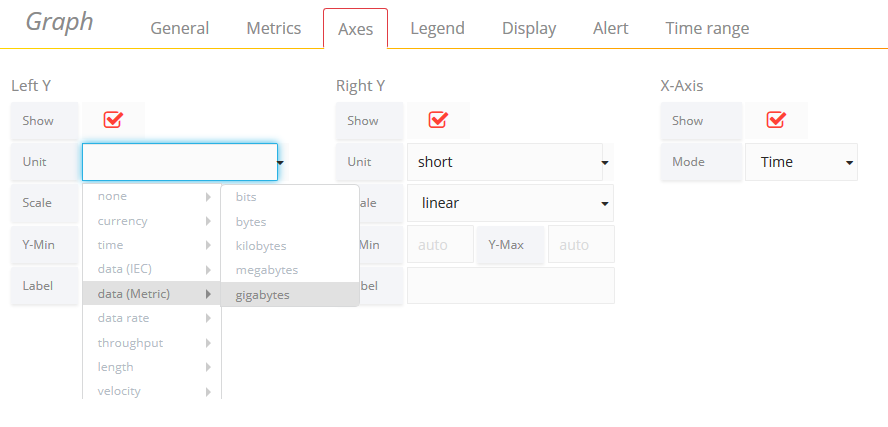
b) change the “unit” in Grafana to use GB
A is better if you want to conver the values and use them in alert messages
B is better if you just want to conver the current value to something else.