I am tapping data from a vessel (ship) where I stream real data from diesel generator sets. Capturing instant fuel consumption (liter/hour) and instant produced energy (KW). The data are collected as “event-based”, whereas changes in the values trigger a sample (datapoint). To transfer and work with this data in InfluxDB are very handy. I have now started to use the Cloud version of InfluxDB together with a collegue, and sharing Notebooks in InfluxDB Cluoud where we are experimening with the data.
We were discussion how we based on the instant produced energy (KW), could caculate the produced energy per a specified time unit for example KW/hour. We were looking into the integral function but did not succeed. There migth be a way to write a more sophisticated Flux query, but we must recognize that we are as per now rather unexperienced in Flux.
We wanted to typically take all the time stamps we have for a 24 hour period and make a query in Flux where we transform the data to produced a report where we can see KW produced per hour in this 24 hour time window.
When looking into the functions in Flux we observed a function called experimental.intergral that we suspect can give more success in what we want to achieve. However we can not fint that this fuction is enabled in our cloud instans of InfluxDB. We can not find how to install it either. Reaching out here if anyone can point us in a direction where we can have this function installed.
Hello @Luhrern,
Very cool use case!
Why didn’t the integral function work for you?
Are you getting any errors when you use the experimental function? If so can you please share them? The experimental functions should be available to you. Silly question but are you including the import statement?
Your response is appreciated. No, your question related to if I include the import statement is not at all silly. I did not.
However I tried to implement some of youe code in my case. Did not suceed, I think I got one number as a result.
I have attached two screenshoots whee you see the code and result. One straigthforward where I get a the result as a graph. And a second where there in only one number.
@Luhrernexperimental.integral() is an aggregate function, so it will only return a single row/value per input table. If you want to track the integral over time windows, use it with aggregateWindow():
Your guidance is much appreciated, I implemented the code you provided in my use case. However I am still struggling to achieve a proper result.
I did
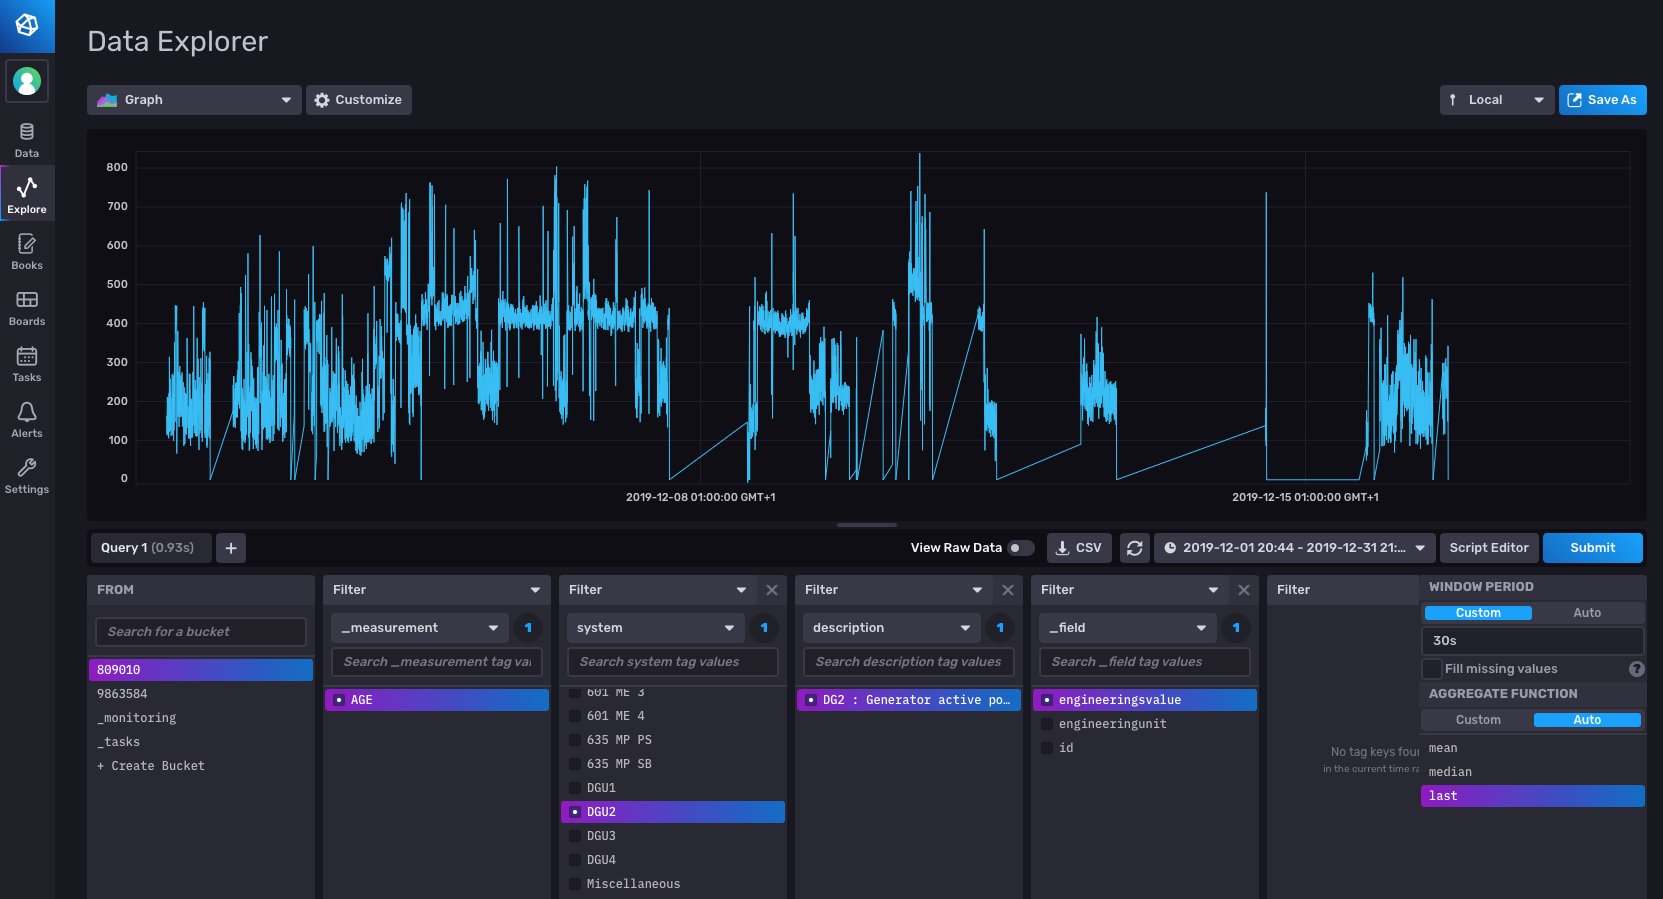
1- A simple query for one signal - KW delivered for Diesel Generator 2 - in Query Builder
2- Switched (1) to Script Editor
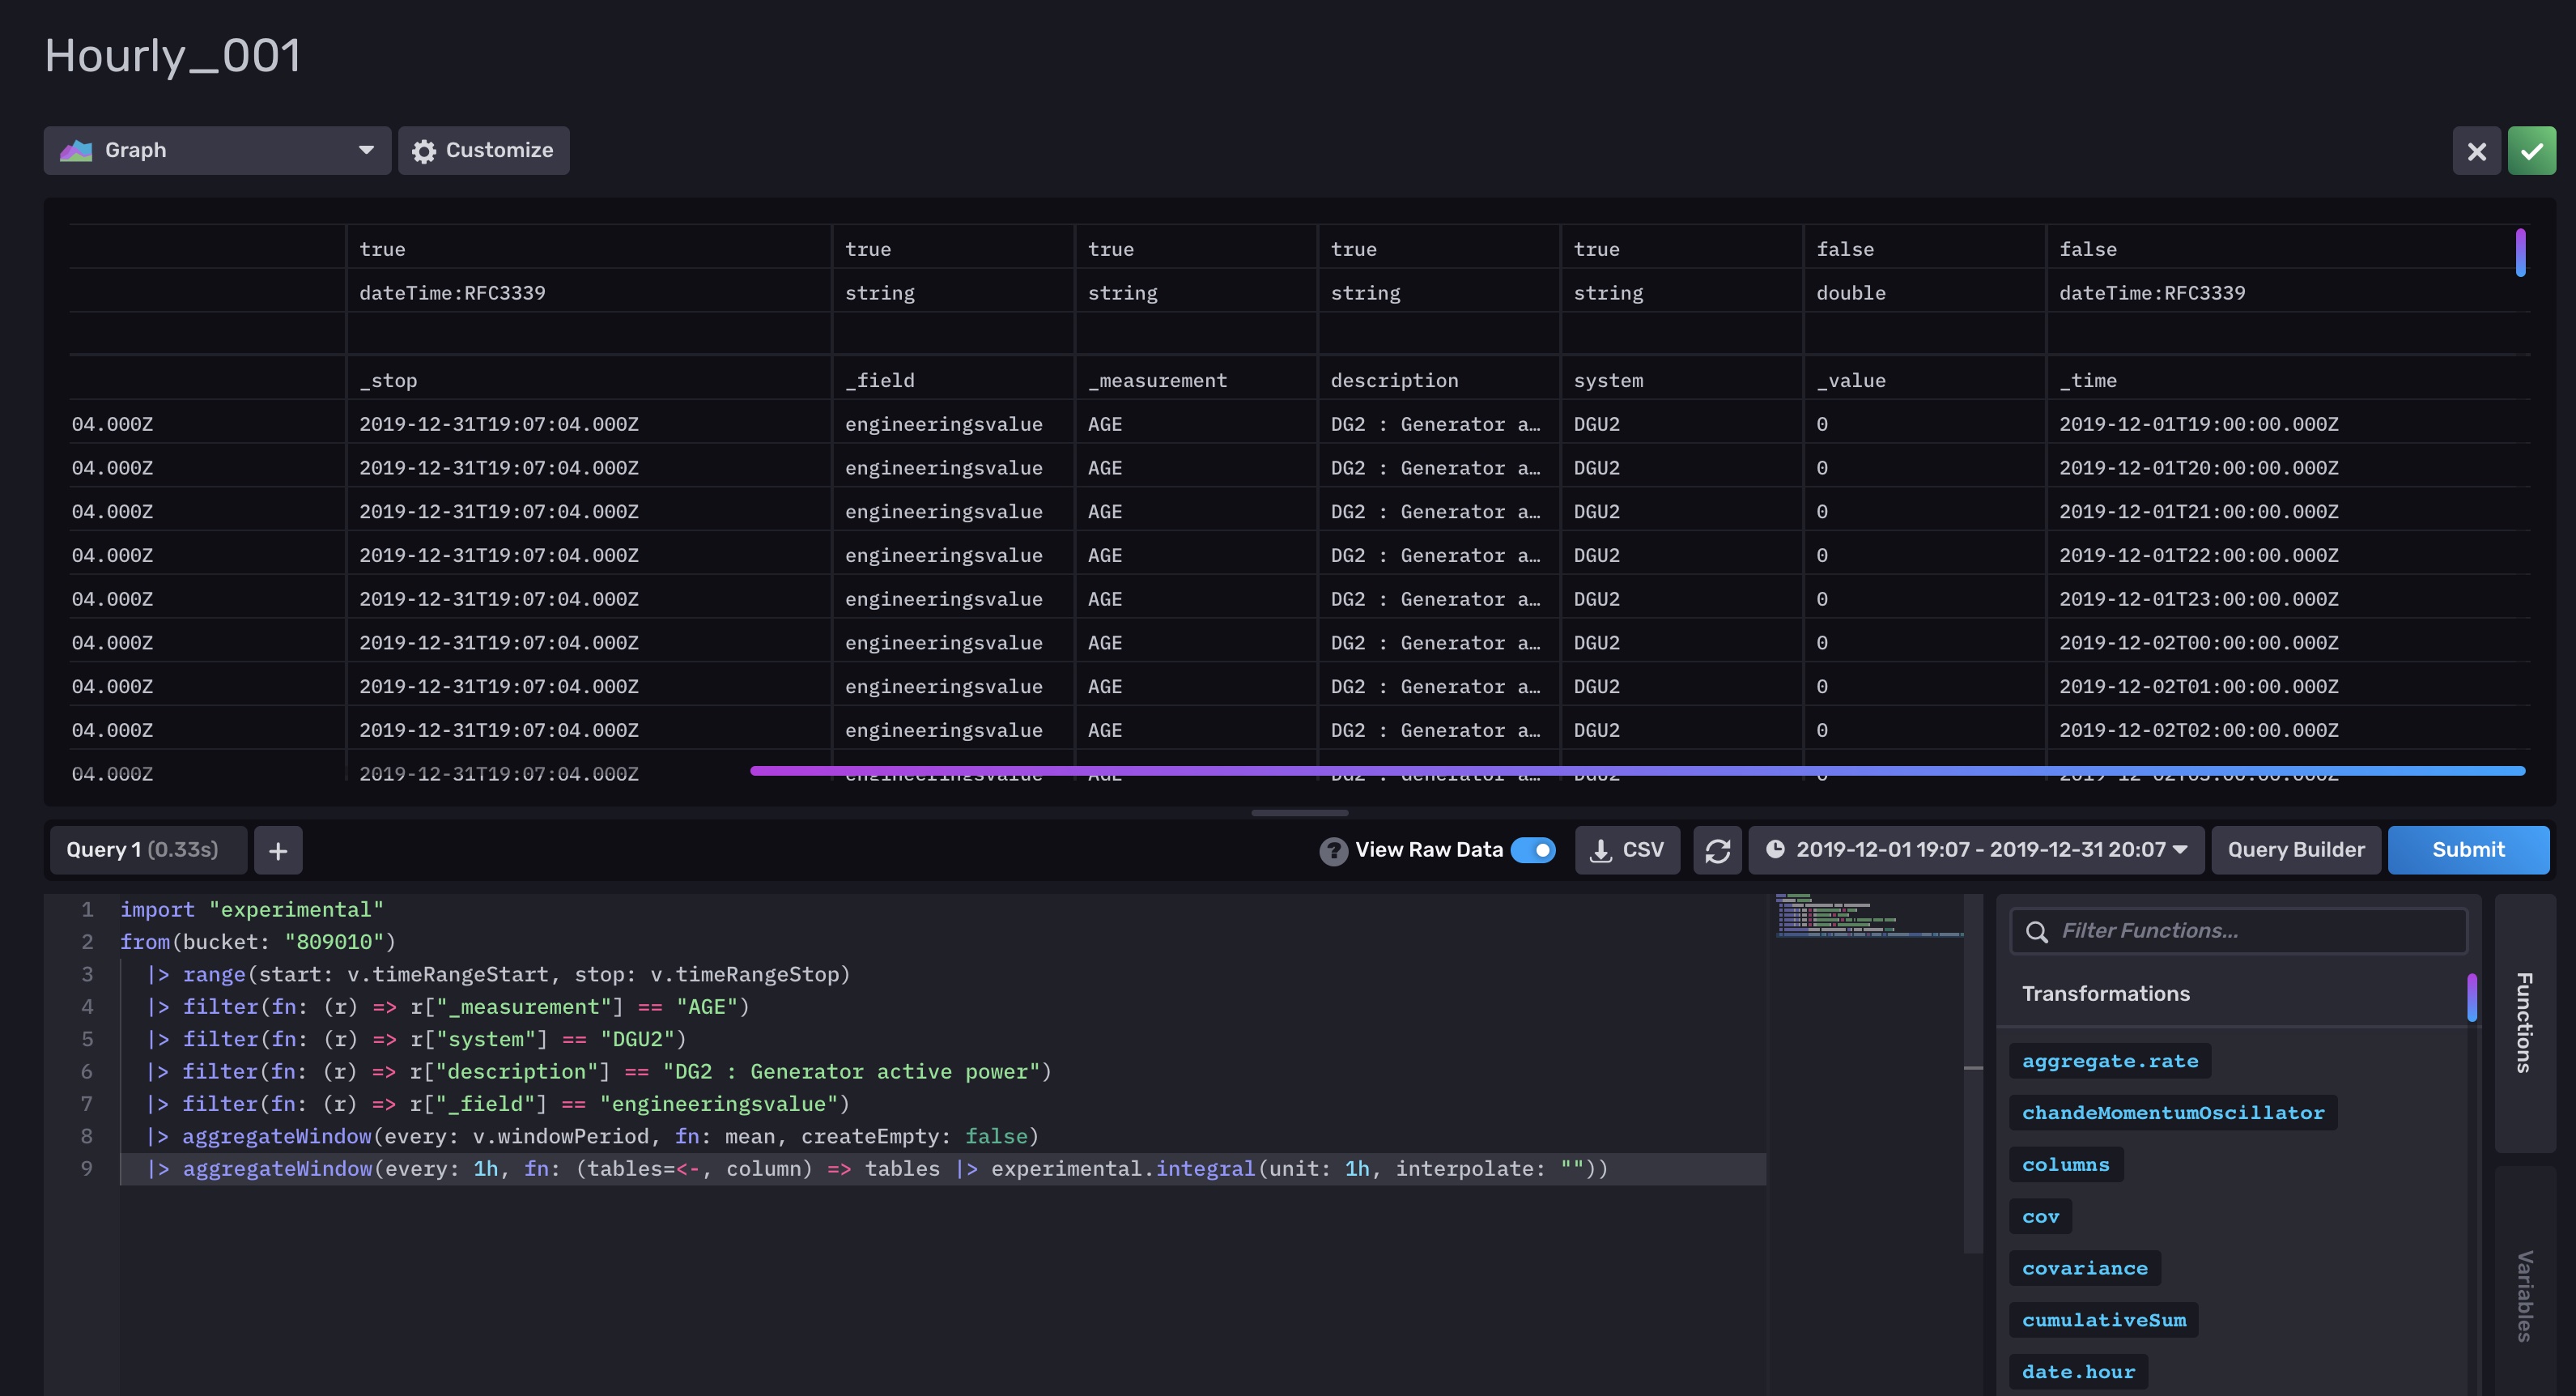
3-Implented some of teh code you sent in (2)
1,2 and 3 are attached as files - screendumps.
Appreciate any support on this theme.
The idea, is to capture teh KW per hour (or any other time window) produced from the GEnerator.
Please find a screendump of teh Flux scrip and graph as accahed files.
You efforts to support me is appreciated. I am afraid i did not succeed now. However when I isnect the raw data I see that teh Flux query returns “hour by hour”. Hence that _value column shows a = (ZERO) during the whole time interval. See enclosed screendump-
I adusted accordingto your guidance and from value 3 (hours) I got meaningful data. I have enclosed a screenshot with where I hav eused teh value 6 (hours), in my case this give a better picture for teh end user for the information.