Will have a look quickly, another error I noticed was this

It is set like this:

When setting up telegraf for the first time I followed these instructions: but have since changed the telegraf config so changed the path, but ran the export command again(with my token copied in) before the telegraf --config one

Not sure if I should put my token in place of the $INFLUX_TOKEN in the config as well? I thought me running the export command took care of that
It does, but only for the current shell , eg while running interactively.
For now to test, just copy copy/paste the raw token into that part of the telegraf config and then restart it.
Okay I did so and from what I understand telegraf --config /etc/telegraf/telegraf.conf --input-filter exec --test works as a update to the telegraf config, which I ran as well, or do you want me to restart the entire telegraf service?
Ey I just checked influxdb again and I found the my_metric…sooo it seems to be working now 
Thanks a lot @FixTestRepeat, just have to figure out how to get grafana to display the data now, as it doesn’t seem to be detecting my database for some reason:
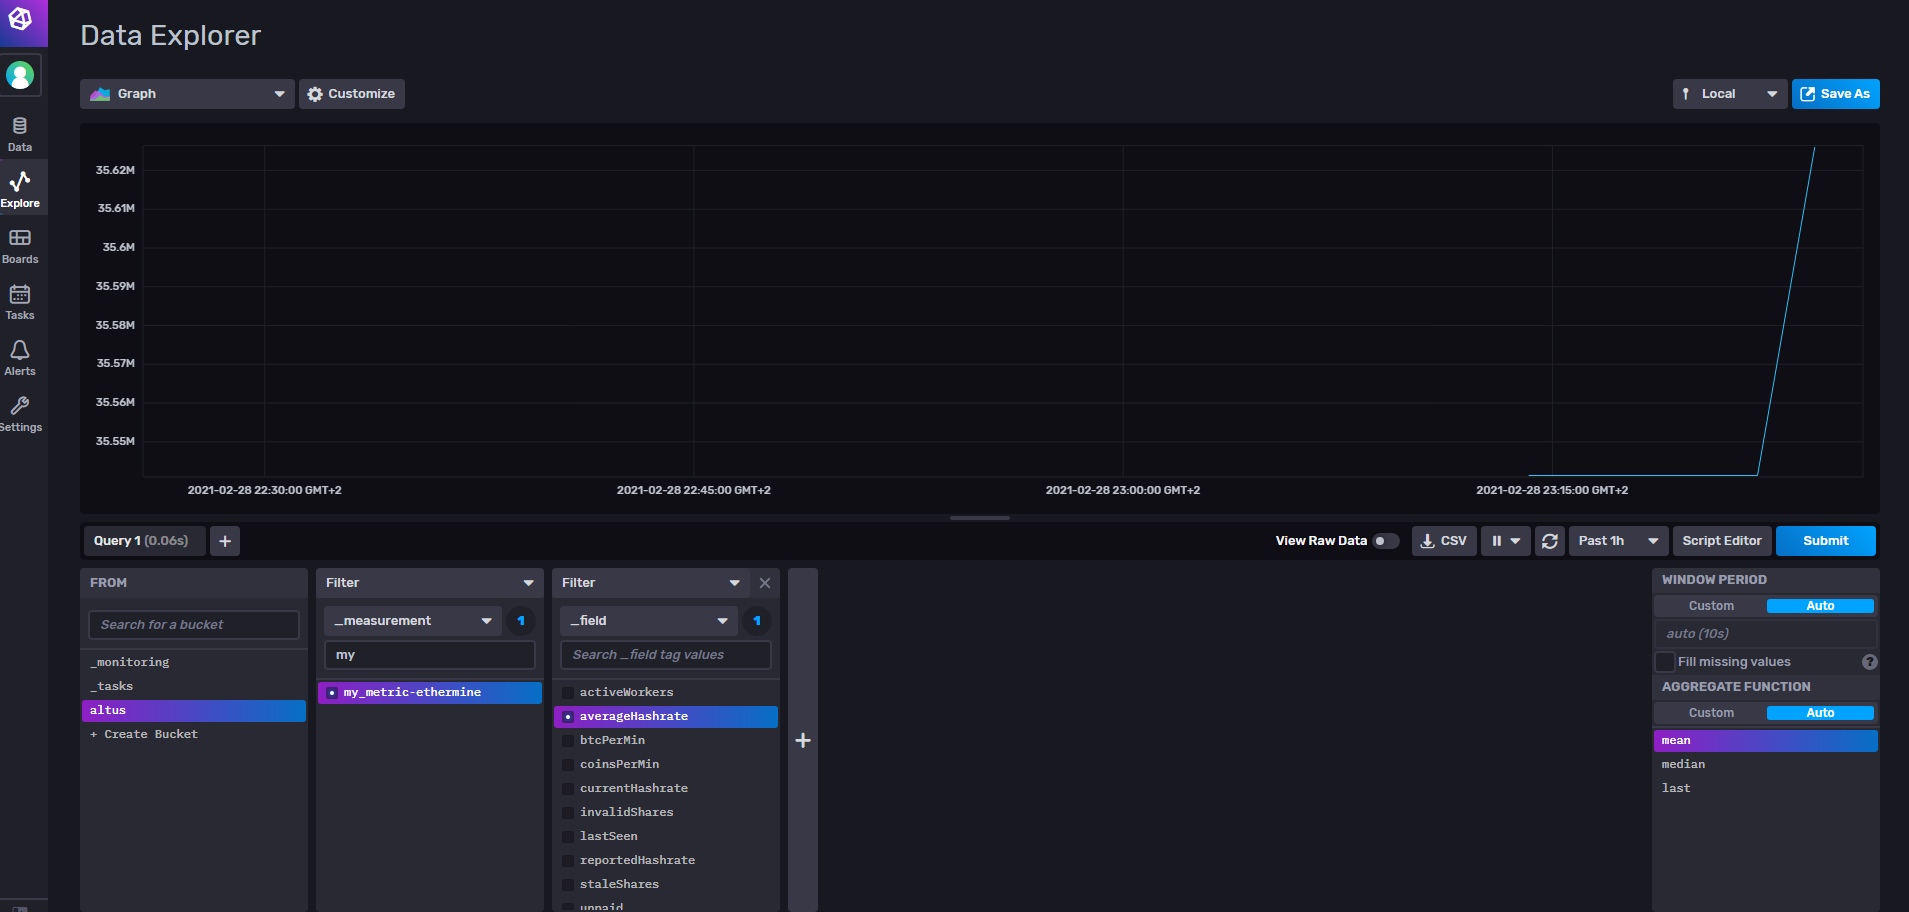
grafana screenshot below: red exclamation reads: InfluxDB Error: database not found: altus

Found a similar issue on google where someone claimed that it is not possible to use an InfluxQL database with a version of grafana higher than a certain number (1.7 or something if I remember correctly)…not sure how valid this claim is, but when I setup my datasource as flux instead of influxQL the red exclam goes away. Now I just need to figure out how flux language works in order to display my data 
I got it working now I’m pretty sure 
Thanks a lot for all your help and time @FixTestRepeat, I really appreciate it.

Now to finish my python script to import more metrics(was just a basic one to get it up and running and test the concept), then to make a nice grafana dashboard, might experiment with chronograph to see which looks better

If you can spare the time, could you summarize all the issues you encountered , and what you did for each to fix them, then mark your reply as solved. This thread may help someone else down the line .
I’ll try my best, I don’t remember all the issues I had, some I fixed without posting them, but the ones I do remember I will summarize tomorrow and write down what I did to fix them (if I can remember )…going to go sleep now 
In my efforts to setup my python script to extract data from ethermine.org API and use telegraf, influxdb and grafana to display the data I encountered a number of issues, I will summarize them here in the hope that it might help the next person who comes across this topic.
-
Issue 1: Could not grafana and influxdb UI through their respective URLs
-
Solution to Issue 1: I had to add a security rule on my AWS instance to allow port access to port 8086,8088,8080 and 3000
-
Issue 2: Was having problems updating my telegraf config
-
Solution to Issue 2: Download the sample config from the influxdb UI and then add whatever plugins/config you need, then copy the file to /etc/telegraf/telegraf.conf
-
Issue 3: Had problems with running my python script using telegraf
-
Solution to Issue 3: I will quote from @FixTestRepeat as he explained it perfectly
Home directories are only permissioned for the user that owns them. There are ways around that, but it’s simply not worth it because it breaks the design.
Solution is to move your script outside your ubuntu user’s home directory to somewhere that is shared by everyone. Eg /usr/local/bin/
Disclaimer: if you’re not sure on any of this, make backups, and get a Linux admin to advise you. I am not responsible if you break your server.
sudo mv -v yourScriptNameHere /usr/local/bin/
sudo chmod 755 /usr/local/bin/yourScriptNameHere
Run the script manually and confirm it actually works from the new location.
Then update the path in the telegraf config. And restart the telegraf service. -
Issue 4: Had an issue with a python2/3 default version mismatch
-
Solution to Issue 4: Add python3 /usr/local/bin/main.py to where your telegraf commands are eg:
[[inputs.exec]]
commands = [“python3 /usr/local/bin/main.py”]
…
… -
Issue 5: Python Script was running and working inside telegraf, but data was not showing up on ifluxdb database
-
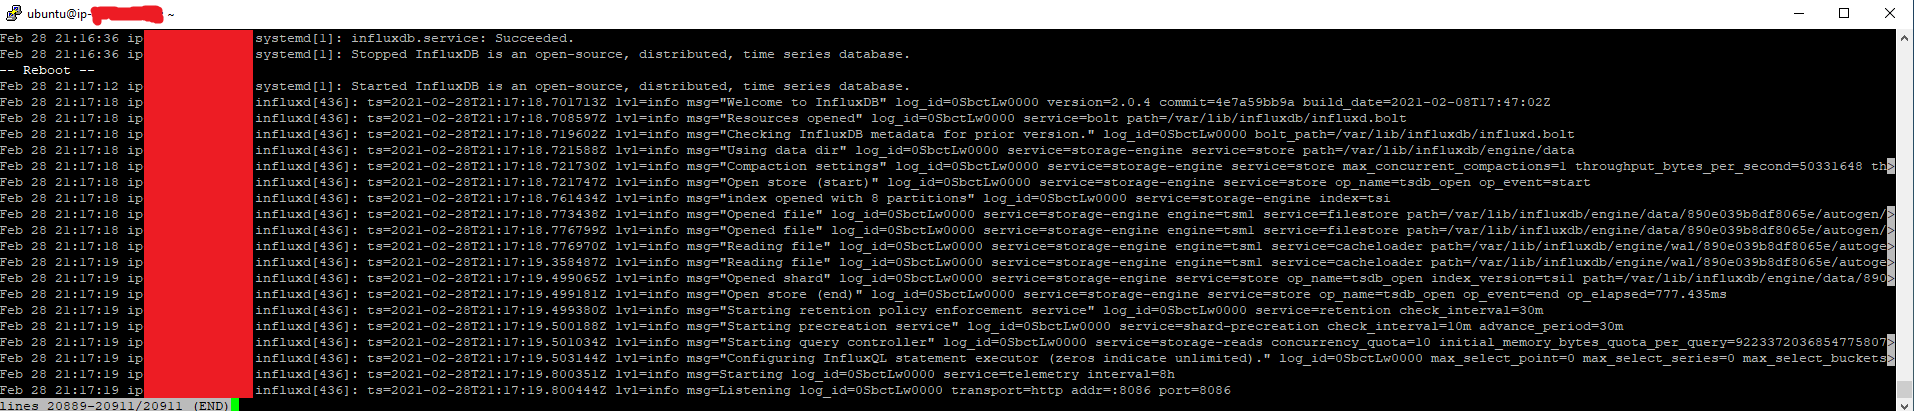
Solution to Issue 5: enable influxdb debug mode like so:
influxd --log-level=debugthen check the logs withsudo journalctl -u influxdb.servicetip: you can use esc+shift+G to go to end of the file
In my case I had an authorization error and the fix was to add the token for authentication into my telegraf config under the [[outputs.influxdb_v2]] plugin with token = “yourtokengoeshere” (you can view your token on the influxdb UI under the data->tokens tab) -
Issue 6:Grafana was not detecting my database
-
Solution to Issue 6: Found a similar issue on google where someone claimed that it is not possible to use an InfluxQL database with a version of grafana higher than a certain number (1.7 or something if I remember correctly)…not sure how valid this claim is, but when I setup my datasource as flux instead of influxQL the error goes away.
For Issue 6: There are detailed instructions about configuring Grafana with InfluxDB v2.0. You can review them here: Use Grafana with InfluxDB OSS | InfluxDB OSS 2.0 Documentation
Instructions are present (and different) based on the language you wish to use; Flux…or InfluxQL (which is primarily available for compatibility with v1.x
I am aware of that page, followed both steps and got my database setup with both flux and influxQL, but the influxQL gave me an error even though it said database is working when clicking the test button…but no matter I got it working using flux
