I ran into the following problem: when I create a dashboard for ping switches and access points, and when I overload some access point or switch separately or together, the alert does not come or comes randomly! Source for alerts Ops genie
Here are my settings, please tell me what’s wrong?
How to make sure that which device is not available in the alert, for example Switch 8 row 1?
Have a look at Grafana alert templating, that’s the way to print actual data inside the alert message.
About the alert not firing I have no idea, you should be able to see what’s going on from the chart itself as it shows when an alert goes pending-alert-ok.
can you provide a screenshot of your chart? (time filter included)
Yes if you need more information - write please!
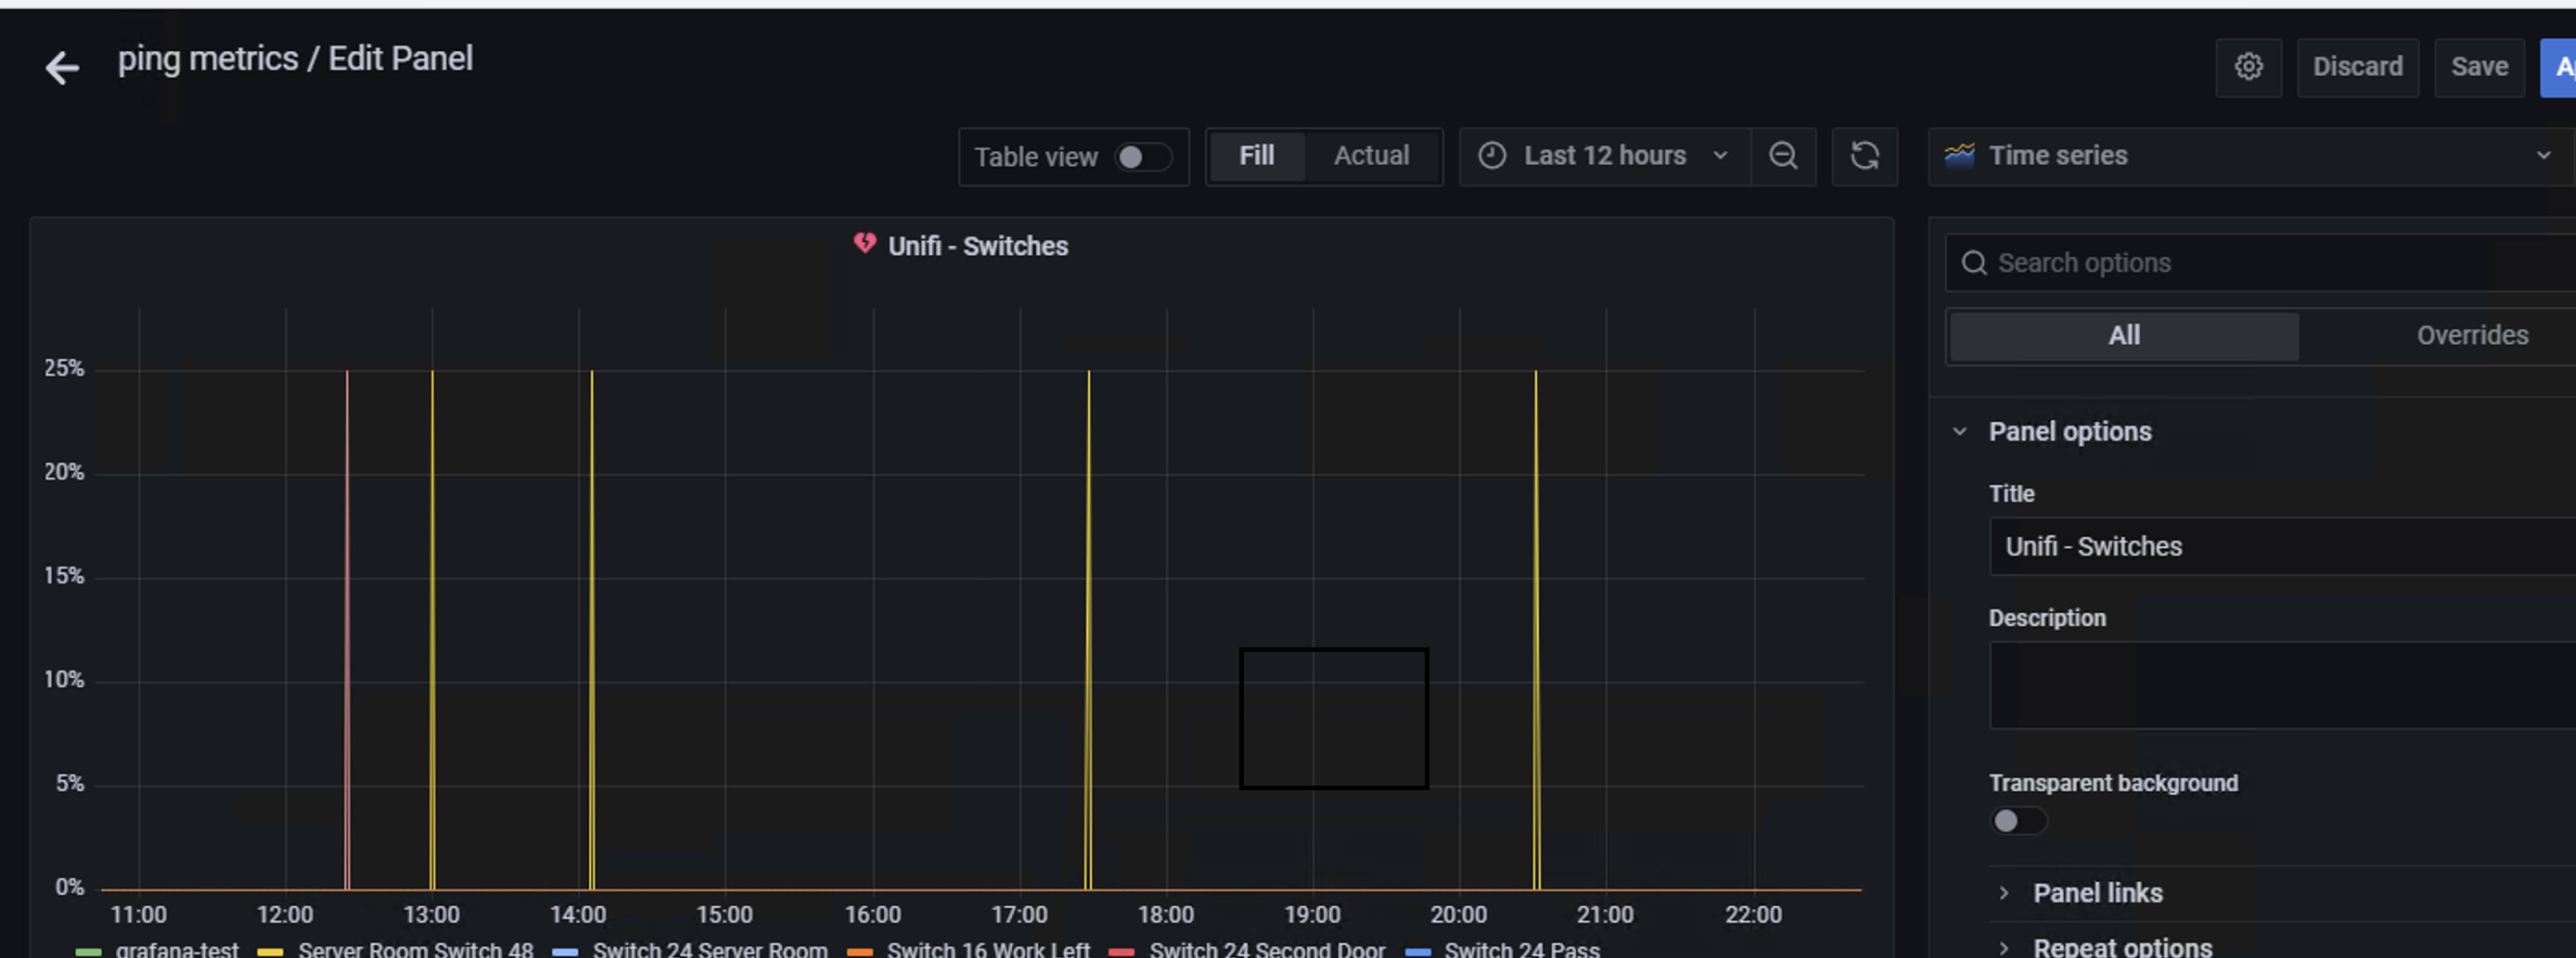
screen|690x256
I can see that no value is over the threshold of 50, which is not even visible, since you are working with percentages you can set the Y-axis to a fixed height (Y-max = 100 or 1)
That said, I can’t really tell you much, as not all the series are clearly visible in the screenshot and I have no idea when they start or end.
Since the threshold has not been reached, the alert must be fired by “if no data or all values are null”, which means that one of the series in the chart did not send data for the last minute.
To check if that’s the case change if no data or all values are null to “ok” and test the rule, I expect the evaluation to return “state = ok”.
Giovanni_Luisotto, thanks. It’s my grafana working space:issue.gz (2.2 MB)
Now my graph


