Hello,
My first post. Hope I am not breaking any rules. As per subject line and picture below, would it be possible to add up all 3 values and display as single value.
Thank you all,
Hello @DMIINC,
Welcome!
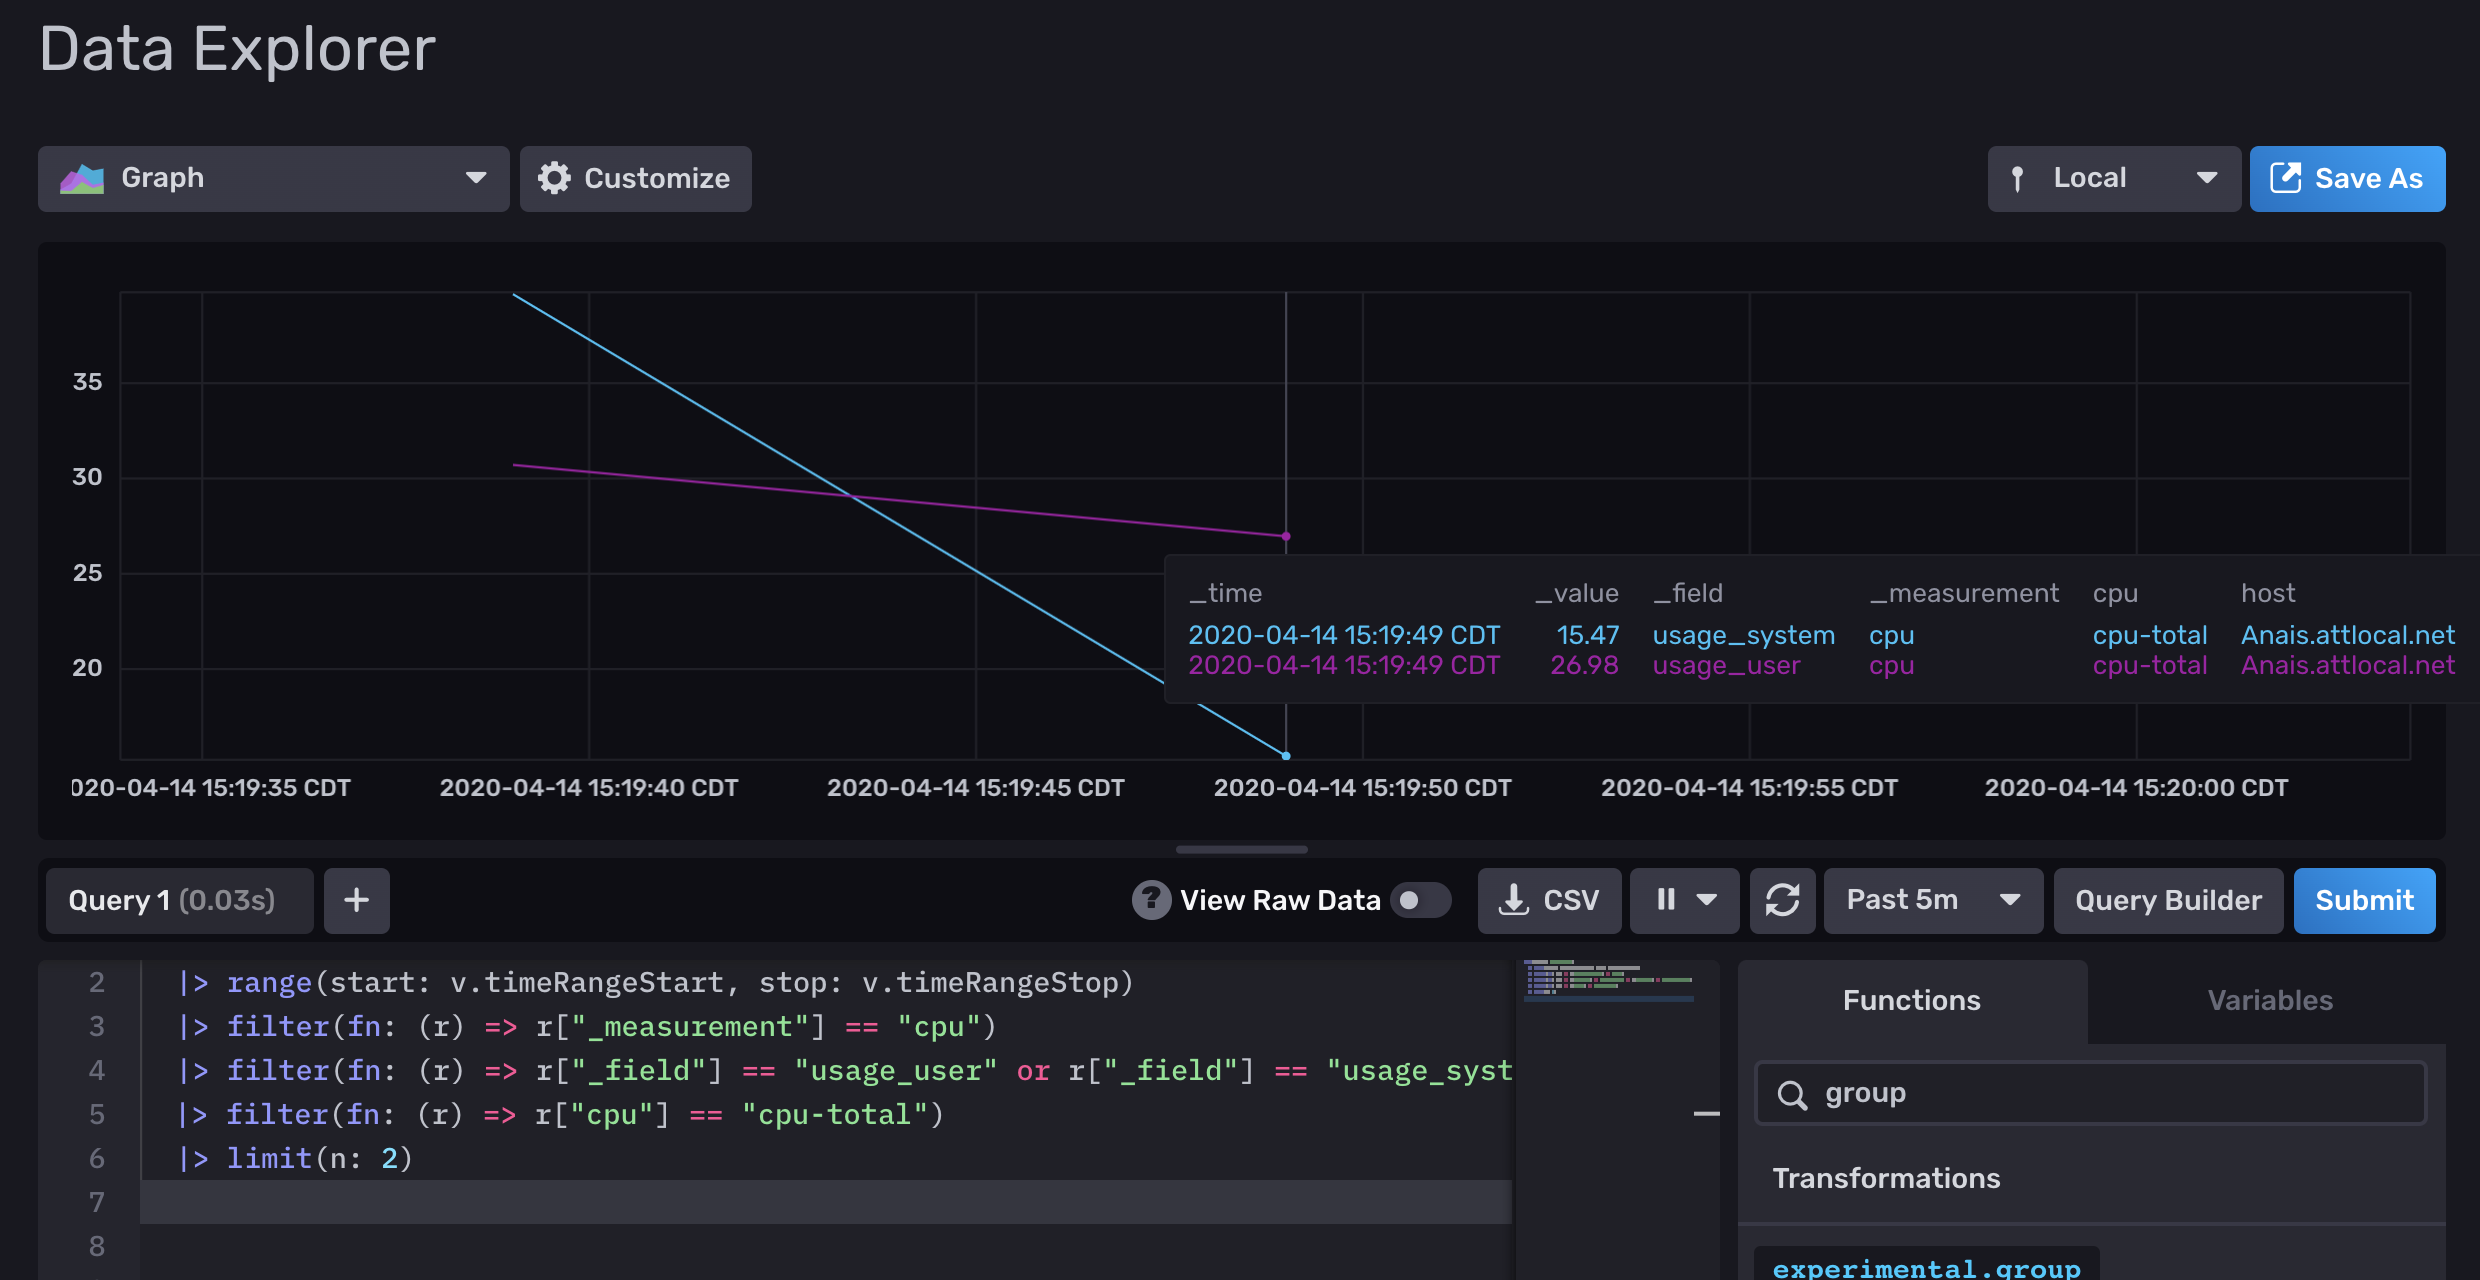
Context/my data:
  |> range(start: v.timeRangeStart, stop: v.timeRangeStop)
  |> filter(fn: (r) => r["_measurement"] == "cpu")
  |> filter(fn: (r) => r["_field"] == "usage_user" or r["_field"] == "usage_system")
  |> filter(fn: (r) => r["cpu"] == "cpu-total")
  |> limit(n: 2)
  |> group(columns: ["_time"], mode:"by")
  |> sum()
Otherwise if you’re looking for a total sum across the entire time, you can do something like:
  |> range(start: v.timeRangeStart, stop: v.timeRangeStop)
  |> filter(fn: (r) => r["_measurement"] == "cpu")
  |> filter(fn: (r) => r["_field"] == "usage_user" or r["_field"] == "usage_system")
  |> filter(fn: (r) => r["cpu"] == "cpu-total")
  |> limit(n: 2)
  |> group()
  |> sum()
Looking to sum up and display last three values from each inverter either when they arrive or at time stamp.
Thank you. Or maybe easiest thing to do is to add last three values every 5 seconds.
@DMIINC,
I would just apply a group by time and a sum and then limit your query by one to get the sum of the last three values.
|> group(columns: ["_time"], mode:"by")
    |> sum()
    |> limit(n:1)
Thank you. I will try. Since I am novice at this I might ask redundant question/s again. Is there any other tool needed other than Chronograph? I appreciate your help.
@DMIINC,
No there isn’t. Please note that the query above is a flux query, however. You might need to enable flux if you haven’t already.
It says that my current source does not support flux.
@DMIINC,
What version of influx are you using? Can you please upgrade to the latest version?
Latest one from web site 1.8.0
Thank you