Hello!
I have the problem with transfering metrics from local Telegraf to Grafana.
data_format = “json”
JSON:
Output from the test Telegraf command:
file,host=tip.local,name=New_Node status=“disconnected” 1719483631000000000
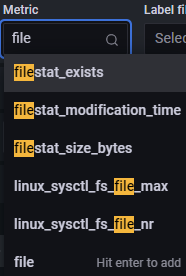
The file param isn’t visible in Grafana yet:
Could you help me, please?
mateo
June 27, 2024, 10:33am
2
Hi @maxilap ,
Telegraf isn’t sending anything to grafana. It needs an intermediary database to be configured for grafana to pull the data from.
So I’m not sure whether you have configured such a database already, there are a multitude of solutions available, but you definetly need one to store your data as a source for grafana.
Here’s the official documentation from grafana on the topic:Documentation on using grafana datasources
A parameter cannot be visible if you haven’t accomplished this step.
take care
Hello @mateo ,
I send output data from Telegraf to Prometheus. This Prometheus already configured like a source in Grafana.
I already have dashboards with metrics from this host, but i ca’t see this new metric in Grafana.
mateo
June 27, 2024, 11:23am
4
Hi @maxilap ,
this obviously changes matters.
May I safely assume that you can find the mentioned metrics in Prometheus?
Is it then possible that prometheus attached another tag for the metric?
I just want to get sure that not only telegraf sees the data, but also prometheus. Based on the information you’ve given this is not yet clear to me.
So what happens when you access the prometheus web frontend and search for the data there?
Also: Do you see in telegraf logs any errors that might indicate what happened to your missing values ?
This metric is also not present in Prometheus. Only in Telegraf.
Telegraf doesn’t have any errors in logs.
mateo
June 27, 2024, 1:06pm
6
Alright that’s something.
what does your
journalctl -fu telegraf
show then? Is there an error that you might have missed earlier?
status=“disconnected”
Your metrics are producing strings. Prometheus will not read string metrics. Metrics are required to be numeric.
1 Like
Thank you!
status:
And Telegraf doesn’t return metric now in test command.
Nothing interesting there(
Did you update your config to not read that as a string?
[[inputs.file]]
  files = ["metrics.json"]
  data_format = "json"
  tag_keys = ["name"]
[
  {
     "id":"b7c9de35-6991-473e-afe8-152e5871f7ac",
     "integrations":"",
     "name":"New_Node",
     "status":0
  },
  {
     "id":"d05aea8e-bc57-4b3c-93e6-093cdd1e882f",
     "integrations":"",
     "name":"Initial access",
     "status":0
  },
  {
     "id":"bb068e87-a697-4c3d-a79d-53963df8b57f",
     "integrations":"",
     "name":"1",
     "status":0
  }
]
./telegraf --config config.toml --once
2024-06-27T15:43:20Z I! Loading config: config.toml
2024-06-27T15:43:20Z I! Starting Telegraf 1.32.0-95a17d9d brought to you by InfluxData the makers of InfluxDB
2024-06-27T15:43:20Z I! Available plugins: 234 inputs, 9 aggregators, 32 processors, 26 parsers, 60 outputs, 6 secret-stores
2024-06-27T15:43:20Z I! Loaded inputs: file
2024-06-27T15:43:20Z I! Loaded aggregators:
2024-06-27T15:43:20Z I! Loaded processors:
2024-06-27T15:43:20Z I! Loaded secretstores:
2024-06-27T15:43:20Z I! Loaded outputs: file
2024-06-27T15:43:20Z I! Tags enabled:
2024-06-27T15:43:20Z D! [agent] Initializing plugins
2024-06-27T15:43:20Z D! [agent] Connecting outputs
2024-06-27T15:43:20Z D! [agent] Attempting connection to [outputs.file]
2024-06-27T15:43:20Z D! [agent] Successfully connected to outputs.file
2024-06-27T15:43:20Z D! [agent] Starting service inputs
2024-06-27T15:43:20Z D! [agent] Stopping service inputs
2024-06-27T15:43:20Z D! [agent] Input channel closed
2024-06-27T15:43:20Z I! [agent] Hang on, flushing any cached metrics before shutdown
file,name=New_Node status=0 1719503001000000000
file,name=Initial\ access status=0 1719503001000000000
file,name=1 status=0 1719503001000000000
2024-06-27T15:43:20Z D! [outputs.file]  Wrote batch of 3 metrics in 40.061µs
2024-06-27T15:43:20Z D! [outputs.file]  Buffer fullness: 0 / 10000 metrics
2024-06-27T15:43:20Z I! [agent] Stopping running outputs
2024-06-27T15:43:20Z D! [agent] Stopped Successfully
1 Like
Thank you very much!


