Hello friends,
I am trying to use http_response telegraf input plugin to monitor multiple websites and systems. I am using result_code as field and based on that I am creating Grafana dashboard to show the status of the website.
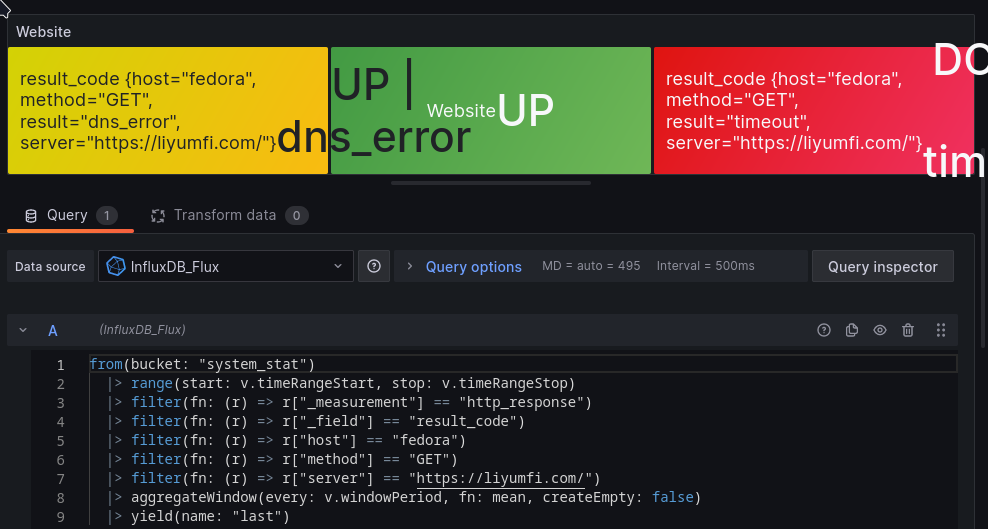
The problem I am facing is, I am getting multiple result_code at a time in influxdb dashboard when I tested the plugin. But, what I am trying to achieve is just to get one result at a time, and it should be that way too I guess. Here is the screenshot:
The http_response plugin is only capable of returning a single status code at a time, take a look at the code itself here. If you truly think this is an issue with Telegraf, then please provide the output from [[outputs.file]] showing two status codes showing up at the same time.
What is more likely occurring is that your flux query or your chart/graph is setup incorrectly and not grouping sufficiently. For example you are aggregating over your window period. Is it possible that multiple return codes occurred during that period?
If you truly think this is an issue with Telegraf, then please provide the output from [[outputs.file]] showing two status codes showing up at the same time
Where do I get that?
What is more likely occurring is that your flux query or your chart/graph is setup incorrectly and not grouping sufficiently. For example you are aggregating over your window period. Is it possible that multiple return codes occurred during that period?
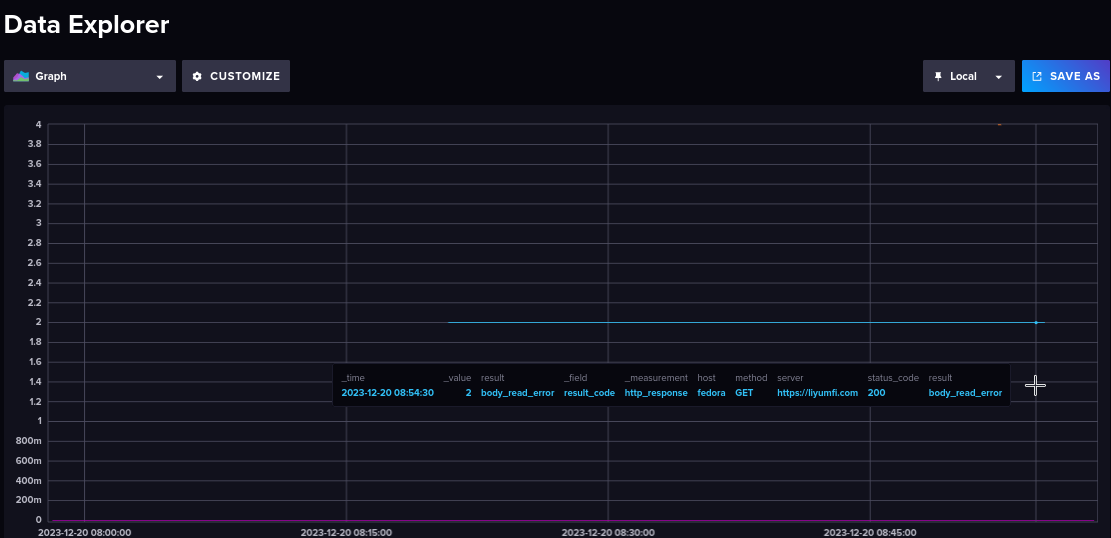
I just used influxdb web to build the query, and I checked last to get the last value.
@jpowers
I have just installed Telegraf using dnf in Fedora, if I try to install Telegraf again it won’t let me after all. Here is telegraf.service daemon file I am using
Please help, I tried my best, removing telegraf and influxdb and reinstalling it but still I am getting multiple results at a time, and in Grafana it looks really bad since it shows two results at a time.
Hello @jpowers
It’s been a while and I couldn’t figure out the problem so far. I have updated telegraf and influxdb multiple times and this specific issue still persists
It is very likely that you have two telegraf running on two different systems or even the same system. My suggestion is to change one of the tags from fedora to something else and see if you still get duplicates or if the tags remain the same.
I say it is very likely because when you used outptus.file you reported that only a single metric showed up. Meaning telegraf is doing the right thing and only producing a single metric.
@jpowers I just checked the influxdb telegraf configuration that I have created, I edited some parts of it as you suggested, but I just saw two [[outputs.influxdb_v2]] I think is that could be the reason, I deleted that and it worked.