Hi to the Community!
As a new at Flux lang I have some quandaries with queries.
Now I have 2 streams to make them united and in seems like this:
data1 = from(bucket: v.bucket)
  |> range(start: v.timeRangeStart, stop: v.timeRangeStop)
  |> filter(fn: (r) => r["host"] == "monitoring")
  |> filter(fn: (r) => r["_field"] == "usage_user")
  |> filter(fn: (r) => r["cpu"] == "cpu-total")

   |> yield(name: "now")

data2 = from(bucket: v.bucket)
  |> range(start: -1h15m, stop: -1h)
  |> filter(fn: (r) => r["host"] == "monitoring")
  |> filter(fn: (r) => r["_field"] == "usage_user")
  |> filter(fn: (r) => r["cpu"] == "cpu-total")
  |> timeShift(duration: 1h)
  |>  yield(name: "old")

  union(tables: [data1, data2] )
Unfortunately, I have a strange line instead of something I had expected:
Ideally, I’m looking for a way to combine two (maybe more) different periods and make a graph from the figures taken by a function like median(), mean(), etc.
I’d appreciate any help to point me to a mistake I made or function I missed.
Influxdb 2.7
Hello @Azimuth,
You might want to order by time with the sort() function after union.
I don’t know if time order is preserved which might be causing the weird line.
Does that help?
Thanks for a suggestion. I overcame this issue by Group fn in Grafana. Also I enlarged my query for a few time periods and took a median from. Also I apply time subtraction. I hope this helps somebody:
import "date"

daysago0 = 7d
daysago1 = 14d
daysago2 = 21d

data1 = from(bucket: "monitoring")
  |> range(start: v.timeRangeStart, stop: v.timeRangeStop)
  |> filter(fn: (r) => r["host"] == "monitoring")
  |> filter(fn: (r) => r["_field"] == "usage_user")
  |> filter(fn: (r) => r["cpu"] == "cpu-total")
  |> group()

data2 = from(bucket: "monitoring")
  |> range(start: date.sub(d: daysago0, from: v.timeRangeStart) , stop: date.sub(d: daysago0, from: v.timeRangeStop))
  |> filter(fn: (r) => r["host"] == "monitoring")
  |> filter(fn: (r) => r["_field"] == "usage_user")
  |> filter(fn: (r) => r["cpu"] == "cpu-total")
  |> timeShift(duration: daysago0)
  |> group()

data3 = from(bucket: "monitoring")
  |> range(start: date.sub(d: daysago1, from: v.timeRangeStart), stop: date.sub(d: daysago1, from: v.timeRangeStop))
  |> filter(fn: (r) => r["host"] == "monitoring")
  |> filter(fn: (r) => r["_field"] == "usage_user")
  |> filter(fn: (r) => r["cpu"] == "cpu-total")
  |> timeShift(duration: daysago1)
  |> group()

data4 = from(bucket: "monitoring")
  |> range(start: date.sub(d: daysago2, from: v.timeRangeStart), stop: date.sub(d: daysago2, from: v.timeRangeStop))
  |> filter(fn: (r) => r["host"] == "monitoring")
  |> filter(fn: (r) => r["_field"] == "usage_user")
  |> filter(fn: (r) => r["cpu"] == "cpu-total")
  |> timeShift(duration: daysago2)
  |> group()

  union(tables: [data1, data2, data3, data4])
  |> aggregateWindow(every: v.windowPeriod,fn: median, column: "_value", createEmpty: false)
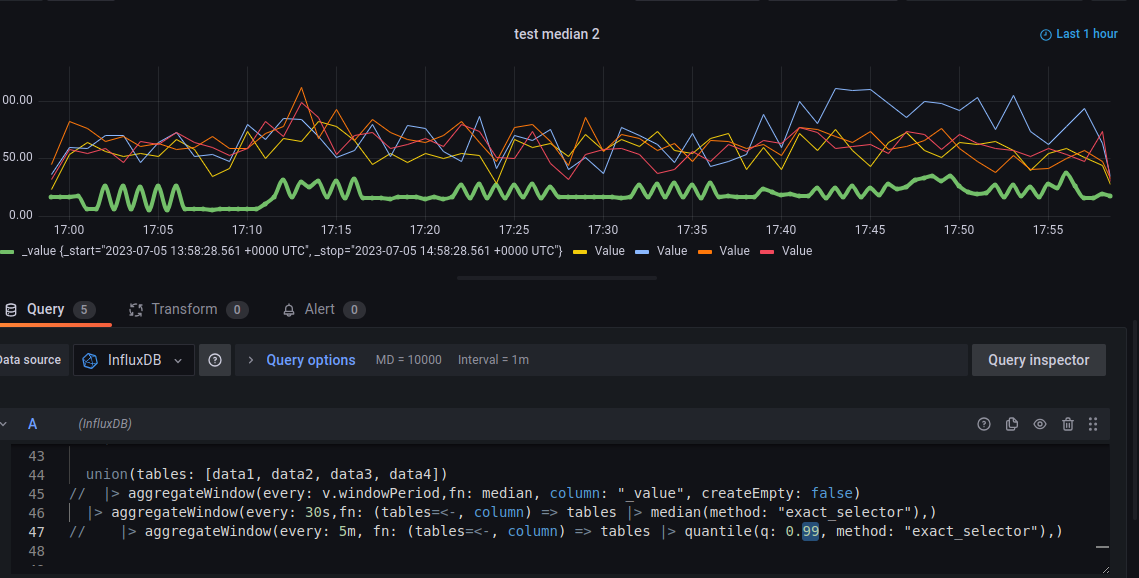
UPD.
Unfortunately, I faced a bad result by using in Grafana. I made all the periods in different queries and found out the median function doesn’t give me a result I had expected.
I tried median and quantile functions as it is given in screenshots.
So, any help is appreciated.