I’m trying to calculate several hosts consumtion together and visualize it in Gafana. When trying one host it works fine, but when trying 2 or more hosts I’m getting confused.
I’m new to this and learning.
host1:
SELECT last(“physical_consumed”) FROM “cpu_util” WHERE (“host” =~ /^host1$/) AND time >= 1593468000000ms GROUP BY time(1h) fill(null)
name: cpu_util
time last
host2:
SELECT last(“physical_consumed”) FROM “cpu_util” WHERE (“host” =~ /^host2$/) AND time >= 1593468000000ms GROUP BY time(1h) fill(null)
name: cpu_util
time last
host1 and host2:
SELECT last(“physical_consumed”) FROM “cpu_util” WHERE (“host” =~ /^(host1|host2)$/) AND time >= 1593468000000ms GROUP BY time(1h) fill(null)
name: cpu_util
time last
Here we can see that it takes some values from each host. And if I add a third the thirds values doesn’t show.
Can someone tell me how I can get the same amount of values from each host?
I would expect it to be 14 values of each host, if I get that when I ask one host. And not that it takes 7 from each(if 2 hosts).
I’m not sure from your question whether you have the host name as a tag on the measurement. If you do that, you can groupby() to get the data reduced by host as multiple series. I like that in a stacked area chart to see who is contributing. Like this for docker metrics. SELECT mean("active_anon") FROM "docker_container_mem" WHERE $timeFilter GROUP BY time($__interval), "container_name" fill(null)
You’ll also want to set the alias to $tag_container_name so it shows nicely in the legend.
I understand what you mean and I’ve done like that on other querys in Grafana.
What I forgott to mention above was that I wanted it presented in as Singlestat. I’ve tried Singlestat Math as well, but there you have to do one query/host and add it in another plase.
It not that funny if you have 10+ hosts you want to calculate on.
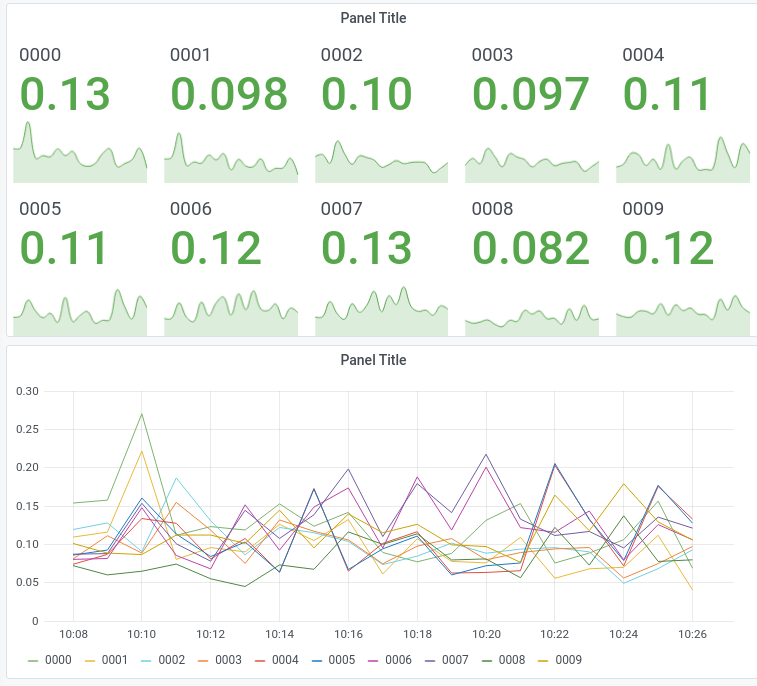
For single stat the multiple series will get you multiple single stats, so to say. The display shows the same metrics, once as time-series line chart and the other as mean() by CPU. This is Grafana 7.0 which makes it look even slicker than before.
What I like about the InfluxDB with Grafana solution is that it will repeat for the series you happen to have in the data.
It looks great, buit I had problem when I upgraded to latest Grafana 7 and the plugins.
Need to test again.
But I like what you have above.
How can I calculate all those number and make them visable in one?
Example: If I had an applikation that use several hosts and they want to now all consumtion together shown in one single stat.
You specify the ‘repeat’ in the general options of the panel, so it will repeat the entire chart for each series returned by the query.
My data has a number of tags that indicate the source of the metric (like user, host, complex). This way I can sum() with group by user to get the summary by user on any host. Or I can sum() with group by host to have the utilization by host, ignoring the user who caused it. You can also groupby host,user but to have breakdown by combination (as long as user typically run only on a single host, it doesn’t explode in the number of series).
Thanks a lot for your answer. I think I need to upgrade Grafana to latest and then test from there. It seems to have better features.
It will take some time(vacation), I will come back if I have anything more after the upgrade.
The repeating panel is way older, but Grafana 6 improved the way they replicate. It’s typically tied to variables, but you can have the variable with ‘all’ to replicate over all series.
Hi, I’m back from vacation now and been looking into it again. Your suggestion with grouping works with DB-command. I’ve tested it in the GUI and still have issues. I probably do it wrong and probably also explained it wrong.
So I will try again from beginning.
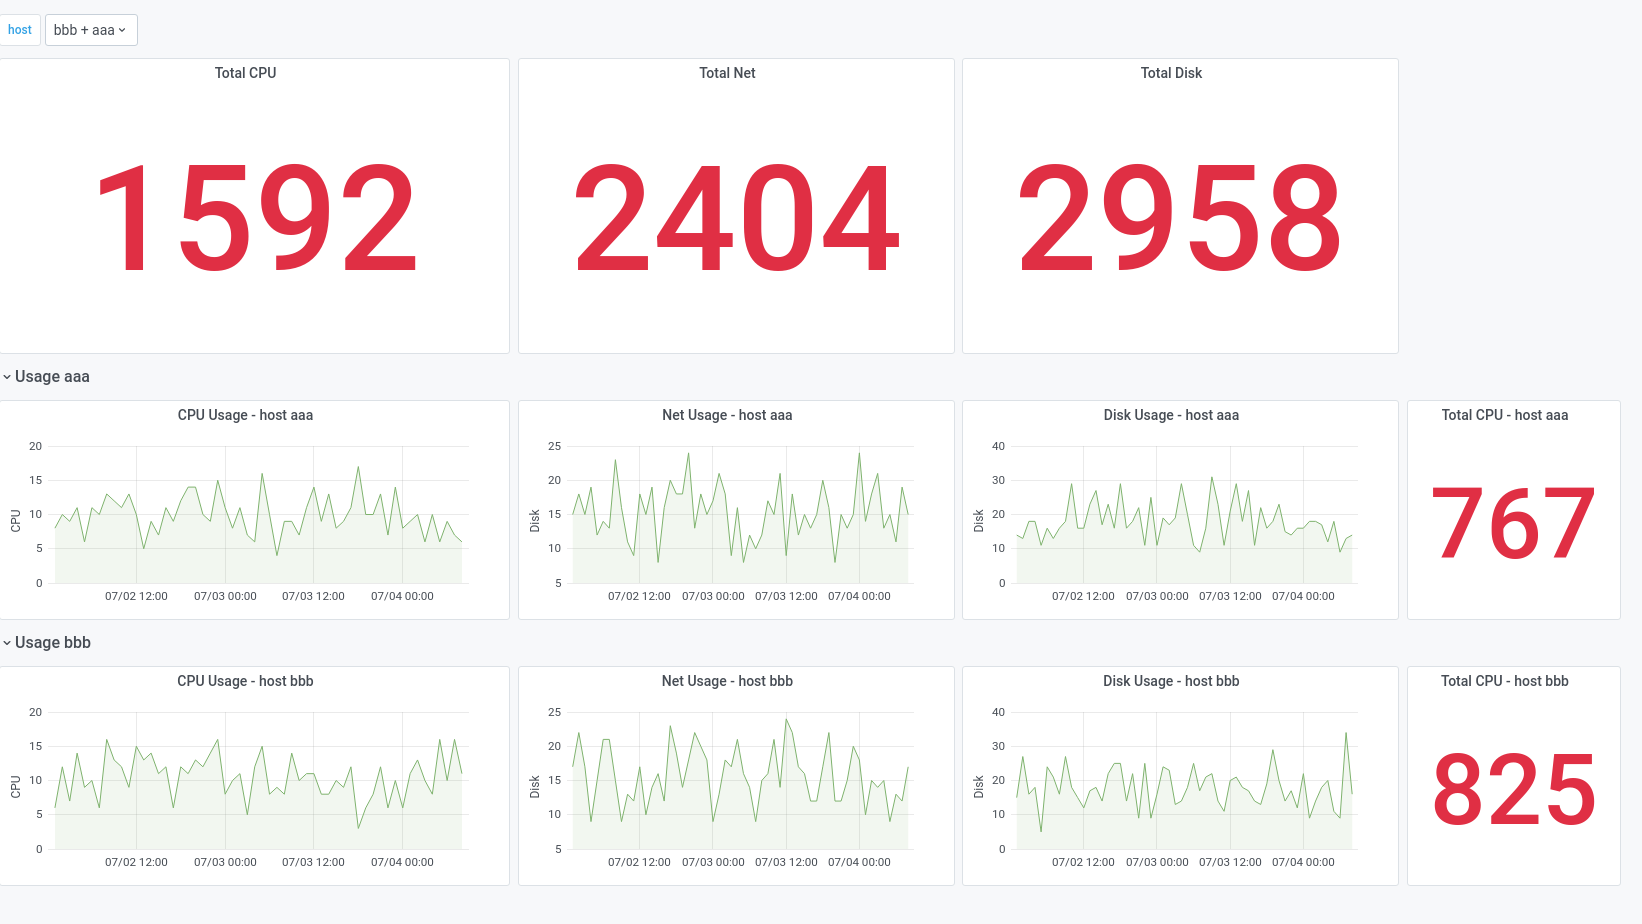
If I have a graph like following;
And the issue I have is that I under ‘Project Total CPU Cost’ want calculate hosts together from each hosts underneath. So red ring should be a sum of blue rings.
Don’t know if this made it more understandable.
I have brain fog right now, but it looks like the regular expression is not doing what you expected. Look at the actual queries generated by Grafana. I notice that your 84.55 is not 84.41 (almost).
You have the hosts hard-coded in the dashboard, that’s not what I meant. There’s the option to make the row automatically repeat for the series in your data. So you would code the clause in the panel like this (assuming the variable is “hostname” - it comes automatically in the editor pull-down)
where (host =~ /^$hostname$/)
Then you set the row to repeat on “hostname” and it will do that all. For your “total” you just need to sum over all series (without the where clause).
I have repeat on the row and on “hostname”.
The issue I have is the Total on the top.
On repeat part I have following query:
SELECT last(“physical_consumed”) *$CPUprice AS CostCPU FROM “cpu_util” WHERE (“host” =~ /^HOST/) AND timeFilter GROUP BY time(__interval) fill(none)
And as you describe I should do sum of the series without the Where-part and it’s here I don’t get it.
This doesn’t work SELECT sum(“physical_consumed”) *$CPUprice AS CostCPU FROM “cpu_util” as it gives a number that is totally wrong.
I understand that I need to get the series in, but don’t know how to put it in the query.
So your metric is a ‘counter’ in that it adds something every interval, right? And you want the increment over the selected time period? How about this:
select sum(non_negative_derivative(physical_consumed, 1h)) from cpu_util
It gets you the usage per hour, and then you sum those over the period you’re looking at.
If you want the total since the beginning of time, you’d do a nested query with last() like you had for the repeated panels (hope I get it right, don’t have the data to try)
select sum(host_total) from (select last(physical_consumed) as host_total from cpu_util group by (host))
You do need to plant time ranges in, or it will be expensive to compute.
Yes, it adds something every interval. I get it correct in the field that is repeating.
I tried your example above but I don’t get it to work. Need to check with someone here that knows more about DB-querys, as I’m not a DB-person.
The issue is that I want to have one or several hosts(repeating fields) summarized in to one under Total.
I do values by day, week (and also month and year, only not included in the example above).
I tested with panel Singlestat Math and there it works, but it’s manual job to add a query per host. Want to be able to pick from a scrolling list.
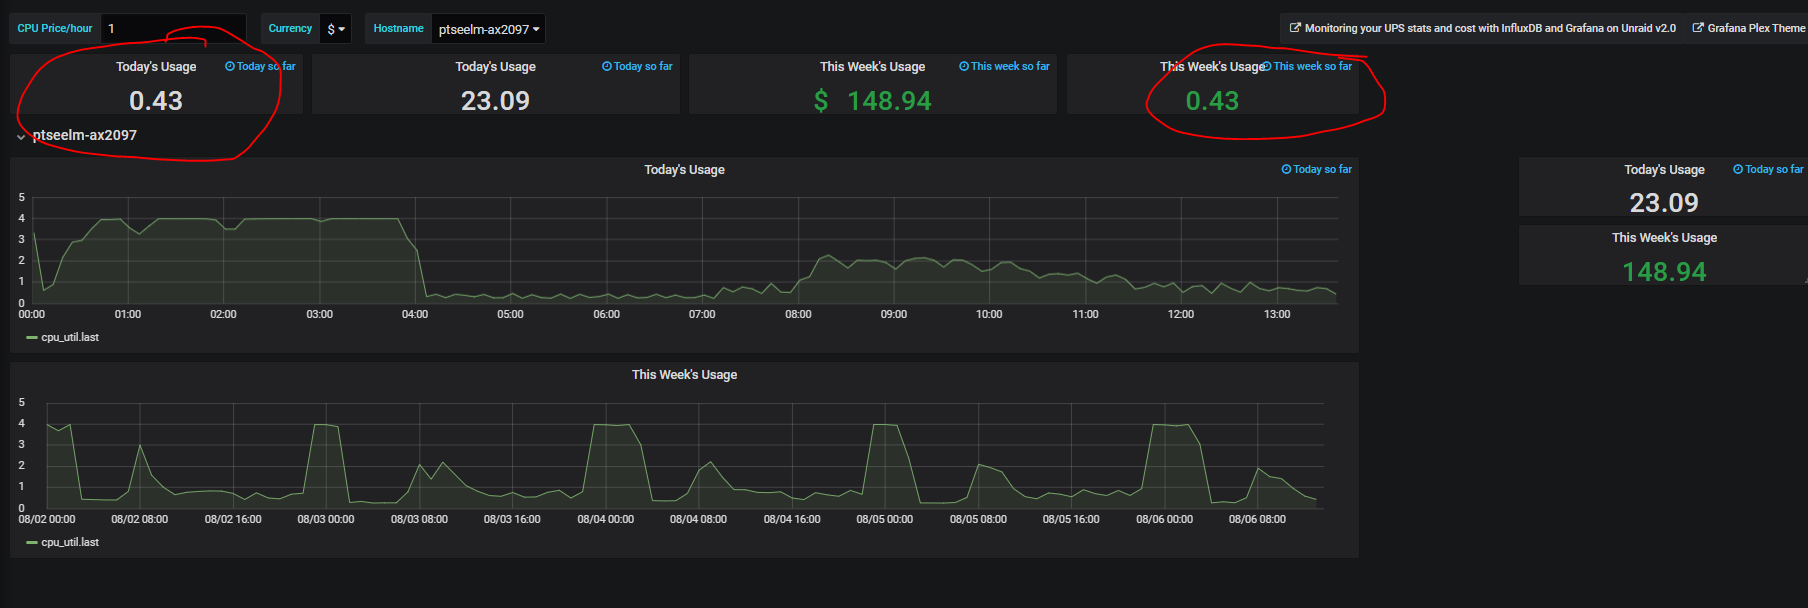
Now I only have one host selected. And I don’t get it to work.
The query I put in for those that is marked with red is: select sum(total) from (SELECT last(“physical_consumed”) AS total FROM “cpu_util” WHERE $timeFilter GROUP BY Hostname)
For those not marked red has the old query. And that looks more correct to me.
The panel to the right should be the same as top panel if I only have one host.
And if I choose more hosts the new value doesn’t change.
I really don’t know what I do wrong.
You are correct, I want it for several hosts that I can pick from a picking list. But If I choose one host it should match between lower and upper result. As you have in the last(the one you’ve zipped.
I don’t know what it is but I don’t get it to work.
I’ve attached a gzip version of my dashboard. TEST3 Issue Cost per host-1597049998693.json.gz (3.0 KB)
There’s a mismatch in the tag names. What is the tag for your host name in the database? The variable refers to “host” but the query suggests “Hostname”. Further, the variable you define is “HOST” but the queries refer to “host” so there’s something fishy.
Also note that the query to populate the variable has the key name without quotes, like this:
SHOW TAG VALUES WITH KEY = Hostname where os = 'AIX'
I have a feeling you’re just getting all records because the filtering is referring to something that doesn’t exist.
Thanks for finding that out. I think I’ve corrected all. But I still doesn’t get it to work.
I’ve attached a new json and hope it looks better. TEST3 Issue Cost per host-1597066010693.json.gz (3.0 KB)
I think you’re on the wrong track with your design. When you have a “counter” value and want to show the “today” and “this week” totals, you can’t use the last() function as that is usage since start of time.
That will give you the hourly usage for the selected host(s) over the select period. You probably would like to use that for the chart as well. -Rob
PS You didn’t fix the variable query yet, I don’t think your pull-down works like this.