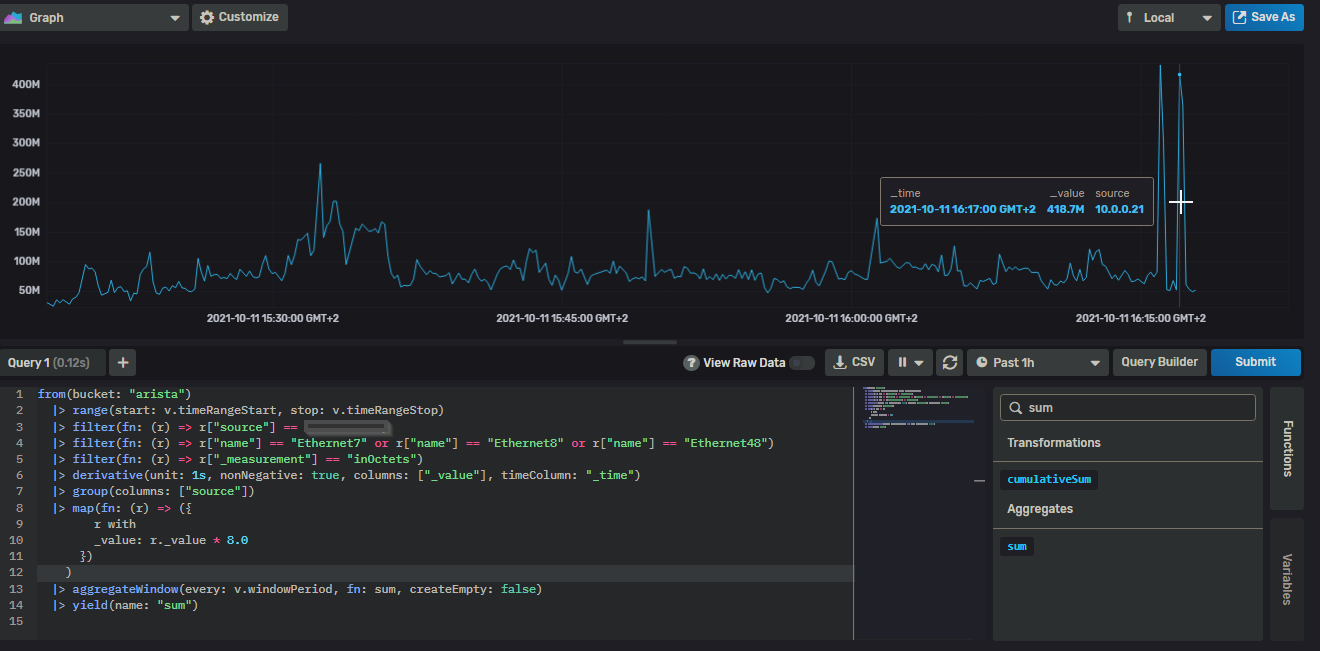
Hi all, I’m currently using this query to get the usage in bytes of my eth interfaces.
from(bucket: "arista")
  |> range(start: v.timeRangeStart, stop: v.timeRangeStop)
  |> filter(fn: (r) => r["source"] == "192.168.1.20")
  |> filter(fn: (r) => r["name"] == "Ethernet7" or r["name"] == "Ethernet8" or r["name"] == "Ethernet48")
  |> filter(fn: (r) => r["_measurement"] == "inOctets")
  |> derivative(unit: 1s, nonNegative: true, columns: ["_value"], timeColumn: "_time")
  |> group(columns: ["source"])
  |> map(fn: (r) => ({
        r with
        _value: r._value * 8.0
      })
    )
  |> aggregateWindow(every: v.windowPeriod, fn: sum, createEmpty: false)
  |> yield(name: "sum")
My doubt is on the aggregateWindow. Do I have to use the sum or last function?
Also, I don’t understand why if I use a wider time range (from 1h to 6h) all data increase its size (look at the pointer hour and value)… Is the query wrong?